AT&T Wireless 2010 Annual Report Download - page 96
Download and view the complete annual report
Please find page 96 of the 2010 AT&T Wireless annual report below. You can navigate through the pages in the report by either clicking on the pages listed below, or by using the keyword search tool below to find specific information within the annual report.-
 1
1 -
2
-
3
-
4
-
5
-
6
-
7
-
8
-
9
-
10
-
11
-
12
-
13
-
14
-
15
-
16
-
17
-
18
-
19
-
20
-
21
-
22
-
23
-
24
-
25
-
26
-
27
-
28
-
29
-
30
-
31
-
32
-
33
-
34
-
35
-
36
-
37
-
38
-
39
-
40
-
41
-
42
-
43
-
44
-
45
-
46
-
47
-
48
-
49
-
50
-
51
-
52
-
53
-
54
-
55
-
56
-
57
-
58
-
59
-
60
-
61
-
62
-
63
-
64
-
65
-
66
-
67
-
68
-
69
-
70
-
71
-
72
-
73
-
74
-
75
-
76
-
77
-
78
-
79
-
80
-
81
-
82
-
83
-
84
-
85
-
 86
86 -
 87
87 -
 88
88 -
 89
89 -
 90
90 -
 91
91 -
 92
92 -
 93
93 -
 94
94 -
 95
95 -
 96
96 -
 97
97 -
 98
98 -
 99
99 -
 100
100 -
 101
101 -
 102
102 -
 103
103 -
 104
104
 |
 |

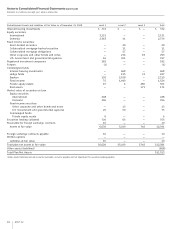
Notes to Consolidated Financial Statements (continued)
Dollars in millions except per share amounts
94 AT&T Inc.
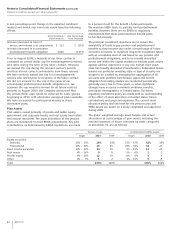
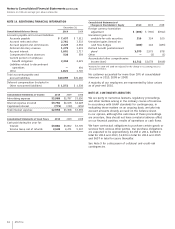
NOTE 14. ADDITIONAL FINANCIAL INFORMATION
December 31,
Consolidated Balance Sheets 2010 2009
Accounts payable and accrued liabilities:
Accounts payable $ 7,437 $ 7,511
Accrued rents and other 2,761 3,333
Accrued payroll and commissions 2,225 2,392
Deferred directory revenue 1,278 1,491
Accrued interest 1,601 1,717
Compensated future absences 538 559
Current portion of employee
benefit obligation 2,394 2,021
Liabilities related to discontinued
operations — 491
Other 1,821 1,745
Total accounts payable and
accrued liabilities $20,055 $21,260
Deferred compensation (included in
Other noncurrent liabilities) $ 1,572 $ 1,538
Consolidated Statements of Income 2010 2009 2008
Advertising expense $2,989 $2,787 $3,050
Interest expense incurred $3,766 $4,108 $4,028
Capitalized interest (772) (740) (659)
Total interest expense $2,994 $3,368 $3,369
Consolidated Statements of Cash Flows 2010 2009 2008
Cash paid during the year for:
Interest $3,882 $3,862 $3,705
Income taxes, net of refunds 3,538 4,471 5,307
Consolidated Statements of
Changes in Stockholders’ Equity 2010 2009 2008
Foreign currency translation
adjustment $ (494) $ (765) $(912)
Unrealized gains on
available-for-sale securities 316 324 100
Unrealized gains (losses) on
cash flow hedges (180) 142 (483)
Defined benefit postretirement
plans1 3,070 2,979 878
Other — (2) (1)
Accumulated other comprehensive
income (loss) $2,712 $2,678 $(418)
1
Amounts for 2009 and 2008 are adjusted for the change in accounting policy as
discussed in Note 1.
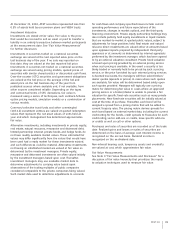
No customer accounted for more than 10% of consolidated
revenues in 2010, 2009 or 2008.
A majority of our employees are represented by labor unions
as of year-end 2010.
NOTE 15. CONTINGENT LIABILITIES
We are party to numerous lawsuits, regulatory proceedings
and other matters arising in the ordinary course of business.
In accordance with GAAP standards for contingencies, in
evaluating these matters on an ongoing basis, we take into
account amounts already accrued on the balance sheet.
In our opinion, although the outcomes of these proceedings
are uncertain, they should not have a material adverse effect
on our financial position, results of operations or cash flows.
We have contractual obligations to purchase certain goods or
services from various other parties. Our purchase obligations
are expected to be approximately $3,158 in 2011, $4,904 in
total for 2012 and 2013, $1,934 in total for 2014 and 2015
and $607 in total for years thereafter.
See Note 9 for a discussion of collateral and credit-risk
contingencies.