AT&T Wireless 2010 Annual Report Download - page 67
Download and view the complete annual report
Please find page 67 of the 2010 AT&T Wireless annual report below. You can navigate through the pages in the report by either clicking on the pages listed below, or by using the keyword search tool below to find specific information within the annual report.-
 1
1 -
2
-
3
-
4
-
5
-
6
-
7
-
8
-
9
-
10
-
11
-
12
-
13
-
14
-
15
-
16
-
17
-
18
-
19
-
20
-
21
-
22
-
23
-
24
-
25
-
26
-
27
-
28
-
29
-
30
-
31
-
32
-
33
-
34
-
35
-
36
-
37
-
38
-
39
-
40
-
41
-
42
-
43
-
44
-
45
-
46
-
47
-
48
-
49
-
50
-
51
-
52
-
53
-
54
-
55
-
56
-
 57
57 -
 58
58 -
 59
59 -
 60
60 -
 61
61 -
 62
62 -
 63
63 -
 64
64 -
 65
65 -
 66
66 -
 67
67 -
 68
68 -
 69
69 -
 70
70 -
 71
71 -
 72
72 -
 73
73 -
 74
74 -
 75
75 -
 76
76 -
 77
77 -
78
-
79
-
80
-
81
-
82
-
83
-
84
-
85
-
86
-
87
-
88
-
89
-
90
-
91
-
92
-
93
-
94
-
95
-
96
-
97
-
98
-
99
-
100
-
101
-
102
-
103
-
104
 |
 |

AT&T Inc. 65
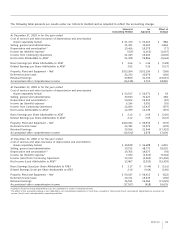
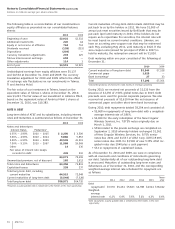
The following table presents our results under our historical method and as adjusted to reflect the accounting change:
Historical As Effect of
Accounting Method Adjusted Change
At December 31, 2010 or for the year ended
Cost of services and sales (exclusive of depreciation and amortization
shown separately below) $ 51,379 $ 52,263 $ 884
Selling, general and administrative 31,221 33,065 1,844
Depreciation and amortization1,2 19,456 19,379 (77)
Income tax (benefit) expense2 (155) (1,162) (1,007)
Income from Continuing Operations 21,045 19,400 (1,645)
Net Income Attributable to AT&T2 21,508 19,864 (1,644)
Basic Earnings per Share Attributable to AT&T $ 3.64 $ 3.36 $ (0.28)
Diluted Earnings per Share Attributable to AT&T 3.62 3.35 (0.27)
Property, Plant and Equipment – Net1 $103,564 $103,196 $ (368)
Deferred income taxes 22,210 22,070 (140)
Retained Earnings 50,859 31,792 (19,067)
Accumulated other comprehensive income (16,128) 2,712 18,840
At December 31, 2009 or for the year ended
Cost of services and sales (exclusive of depreciation and amortization
shown separately below) $ 50,517 $ 50,571 $ 54
Selling, general and administrative 30,943 31,427 484
Depreciation and amortization1,2 19,602 19,515 (87)
Income tax (benefit) expense2 6,146 6,091 (55)
Income from Continuing Operations 12,824 12,427 (397)
Net Income Attributable to AT&T2 12,535 12,138 (397)
Basic Earnings per Share Attributable to AT&T $ 2.12 $ 2.06 $ (0.06)
Diluted Earnings per Share Attributable to AT&T 2.12 2.05 (0.07)
Property, Plant and Equipment – Net1 $100,052 $ 99,519 $ (533)
Deferred income taxes 23,781 23,579 (202)
Retained Earnings 39,366 21,944 (17,422)
Accumulated other comprehensive income (14,412) 2,678 17,090
At December 31, 2008 or for the year ended
Cost of services and sales (exclusive of depreciation and amortization
shown separately below) $ 49,878 $ 56,688 $ 6,810
Selling, general and administrative 30,752 48,772 18,020
Depreciation and amortization1,2 19,766 19,673 (93)
Income tax (benefit) expense2 7,034 (2,210) (9,244)
Income (Loss) from Continuing Operations 13,130 (2,362) (15,492)
Net Income (Loss) Attributable to AT&T2 12,867 (2,625) (15,492)
Basic Earnings (Loss) per Share Attributable to AT&T $ 2.17 $ (0.44) $ (2.61)
Diluted Earnings (Loss) per Share Attributable to AT&T 2.16 (0.44) (2.60)
Property, Plant and Equipment – Net1 $ 99,037 $ 98,415 $ (622)
Deferred income taxes 19,171 18,935 (236)
Retained Earnings 36,591 19,566 (17,025)
Accumulated other comprehensive income (17,057) (418) 16,639
1A portion of pension and postretirement costs are capitalized as a part of construction labor.
2 The effect of the accounting change is also reflected in our consolidated statements of cash flows, included in “Net income (loss)” and relevant adjustments to reconcile net
income (loss) to net cash provided by operating activities.