AT&T Wireless 2010 Annual Report Download - page 33
Download and view the complete annual report
Please find page 33 of the 2010 AT&T Wireless annual report below. You can navigate through the pages in the report by either clicking on the pages listed below, or by using the keyword search tool below to find specific information within the annual report.-
 1
1 -
2
-
3
-
4
-
5
-
6
-
7
-
8
-
9
-
10
-
11
-
12
-
13
-
14
-
15
-
16
-
17
-
18
-
19
-
20
-
21
-
22
-
 23
23 -
 24
24 -
 25
25 -
 26
26 -
 27
27 -
 28
28 -
 29
29 -
 30
30 -
 31
31 -
 32
32 -
 33
33 -
 34
34 -
 35
35 -
 36
36 -
 37
37 -
 38
38 -
 39
39 -
 40
40 -
 41
41 -
 42
42 -
 43
43 -
44
-
45
-
46
-
47
-
48
-
49
-
50
-
51
-
52
-
53
-
54
-
55
-
56
-
57
-
58
-
59
-
60
-
61
-
62
-
63
-
64
-
65
-
66
-
67
-
68
-
69
-
70
-
71
-
72
-
73
-
74
-
75
-
76
-
77
-
78
-
79
-
80
-
81
-
82
-
83
-
84
-
85
-
86
-
87
-
88
-
89
-
90
-
91
-
92
-
93
-
94
-
95
-
96
-
97
-
98
-
99
-
100
-
101
-
102
-
103
-
104
 |
 |

AT&T Inc. 31
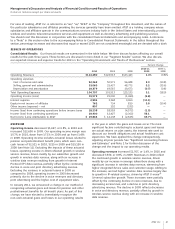
Management’s Discussion and Analysis of Financial Condition and Results of Operations
Dollars in millions except per share amounts
in the year in which the gains and losses occur. The most
significant factors contributing to actuarial gains and losses
are actual returns on plan assets, the interest rate used to
discount our benefit obligations and actual healthcare cost
experience. We have applied this change retrospectively,
adjusting all prior periods. See “Significant Accounting Policies
and Estimates” and Note 1 for further discussion of the
change and the impact to our operating results.
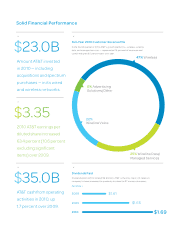
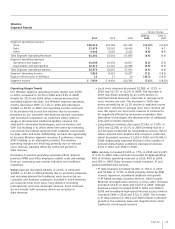
Operating revenues increased $1,767, or 1.4%, in 2010 and
decreased $930, or 0.8%, in 2009. Revenues in 2010 reflect
the continued growth in wireless service revenue, driven
mostly by our increase in average subscribers along with a
significant increase in wireless data revenue, stemming from
higher integrated device sales and customer usage. Adding to
the increase, we had higher wireline data revenue largely due
to growth in IP-related services, driven by AT&T U-verseSM
(U-verse) subscriber growth. These increases were partially
offset by the continuing decline in voice revenues, due to
decreasing access lines, and a decline in print directory
advertising revenue. The decline in 2009 reflects decreases
in voice and directory revenue, partially offset by growth in
wireless service revenue along with an increase in wireline
data revenue.
OVERVIEW
Operating income decreased $1,427, or 6.8%, in 2010 and
increased $22,690 in 2009. Our operating income margin was
15.7% in 2010, down from 17.1% in 2009 and up from (1.4)%
in 2008. Operating income includes actuarial losses related to
pension and postretirement benefit plans, which were non-
cash losses of $2,521 in 2010, $215 in 2009 and $25,150 in
2008 (see Note 11). Excluding the impacts of these actuarial
losses, operating income in 2010 reflected growth in wireless
service revenue, driven mostly by our subscriber growth and
growth in wireless data revenue, along with an increase in
wireline data revenue resulting from growth in Internet
Protocol (IP) data revenue, partially offset by the continuing
decline in voice and print directory advertising revenue.
Excluding the variance in actuarial losses in 2009 as
compared to 2008, operating income in 2009 decreased
primarily due to the decline in voice revenues and directory
print advertising and the higher cost of equipment sales.
In January 2011, we announced a change in our method of
recognizing actuarial gains and losses for pension and other
postretirement benefits for all benefit plans. As part of this
change, we have elected to immediately recognize the
non-cash actuarial gains and losses in our operating results
For ease of reading, AT&T Inc. is referred to as “we,” “us,” “AT&T” or the “Company” throughout this document, and the names of
the particular subsidiaries and affiliates providing the services generally have been omitted. AT&T is a holding company whose
subsidiaries and affiliates operate in the communications services industry both in the United States and internationally, providing
wireless and wireline telecommunications services and equipment as well as directory advertising and publishing services.
You should read this discussion in conjunction with the consolidated financial statements and accompanying notes. A reference
to a “Note” in this section refers to the accompanying Notes to Consolidated Financial Statements. In the tables throughout this
section, percentage increases and decreases that equal or exceed 100% are not considered meaningful and are denoted with a dash.
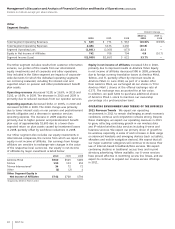
RESULTS OF OPERATIONS
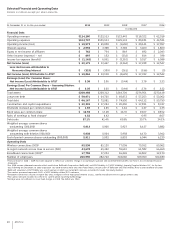
Consolidated Results Our financial results are summarized in the table below. We then discuss factors affecting our overall
results for the past three years. These factors are discussed in more detail in our “Segment Results” section. We also discuss
our expected revenue and expense trends for 2011 in the “Operating Environment and Trends of the Business” section.
Percent Change
2010 vs. 2009 vs.
2010 2009 2008 2009 2008
Operating Revenues $124,280 $122,513 $123,443 1.4% (0.8)%
Operating expenses
Cost of services and sales 52,263 50,571 56,688 3.3 (10.8)
Selling, general and administrative 33,065 31,427 48,772 5.2 (35.6)
Depreciation and amortization 19,379 19,515 19,673 (0.7) (0.8)
Total Operating Expenses 104,707 101,513 125,133 3.1 (18.9)
Operating Income (Loss) 19,573 21,000 (1,690) (6.8) —
Interest expense 2,994 3,368 3,369 (11.1) —
Equity in net income of affiliates 762 734 819 3.8 (10.4)
Other income (expense) – net 897 152 (332) — —
Income (loss) from continuing operations before income taxes 18,238 18,518 (4,572) (1.5) —
Income (loss) from continuing operations 19,400 12,427 (2,362) 56.1 —
Net Income (Loss) Attributable to AT&T $ 19,864 $ 12,138 $ (2,625) 63.7% —