AT&T Wireless 2010 Annual Report Download - page 38
Download and view the complete annual report
Please find page 38 of the 2010 AT&T Wireless annual report below. You can navigate through the pages in the report by either clicking on the pages listed below, or by using the keyword search tool below to find specific information within the annual report.-
 1
1 -
2
-
3
-
4
-
5
-
6
-
7
-
8
-
9
-
10
-
11
-
12
-
13
-
14
-
15
-
16
-
17
-
18
-
19
-
20
-
21
-
22
-
23
-
24
-
25
-
26
-
27
-
 28
28 -
 29
29 -
 30
30 -
 31
31 -
 32
32 -
 33
33 -
 34
34 -
 35
35 -
 36
36 -
 37
37 -
 38
38 -
 39
39 -
 40
40 -
 41
41 -
 42
42 -
 43
43 -
 44
44 -
 45
45 -
 46
46 -
 47
47 -
 48
48 -
49
-
50
-
51
-
52
-
53
-
54
-
55
-
56
-
57
-
58
-
59
-
60
-
61
-
62
-
63
-
64
-
65
-
66
-
67
-
68
-
69
-
70
-
71
-
72
-
73
-
74
-
75
-
76
-
77
-
78
-
79
-
80
-
81
-
82
-
83
-
84
-
85
-
86
-
87
-
88
-
89
-
90
-
91
-
92
-
93
-
94
-
95
-
96
-
97
-
98
-
99
-
100
-
101
-
102
-
103
-
104
 |
 |

Management’s Discussion and Analysis of Financial Condition and Results of Operations (continued)
Dollars in millions except per share amounts
36 AT&T Inc.
The increase in 2009 was primarily due to the following:
•Equipmentcostsincreased$1,246andcommission
expenses increased $112 driven by the higher cost of
acquiring and selling more advanced integrated devices
compared to prior years.
•Interconnect,USFandnetworksystemcostsincreased
$435 due to higher network traffic, network
enhancement efforts, revenue growth, and a USF
rate increase.
•Administrativeexpensesincreased$291dueinpart
to higher information technology and finance costs.
•Baddebtexpenseandcustomerservicecosts
increased $274 due to customer growth.
These increases were partially offset by selling expense
(other than commissions) decreases totaling $139, attributable
to lower traditional handset sales exceeding the impact of
the sale of advanced integrated devices, and long-distance
and reseller services cost decreases totaling $134 due to
usage and rate declines.
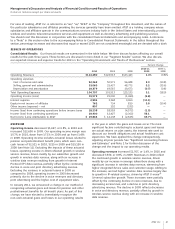
Depreciation and amortization increased $454, or 7.5%,
in 2010 and $18, or 0.3%, in 2009. Depreciation expense
increased $751, or 17.0%, in 2010 primarily due to increased
capital spending for network upgrades and expansion and
depreciation for assets acquired with our acquisition of
Centennial Communications Corp. (Centennial), partially
offset by certain network assets becoming fully depreciated.
Amortization expense decreased $297, or 18.4%, in 2010
primarily due to lower amortization of intangibles for
customer lists related to acquisitions, partially offset by
an increase in customer lists amortization related to the
Centennial acquisition.
Depreciation expense increased $468, or 11.8%, in 2009
due to ongoing capital spending for network upgrades
and expansion, partially offset by certain network assets
becoming fully depreciated. Amortization expense decreased
$450, or 21.8%, in 2009 due to lower amortization of
intangibles attributable to our acquisition of BellSouth
Corporation (BellSouth), partially offset by amortization
of intangible assets attributable to subscribers added in
the November 2009 acquisition of Centennial and the
2007 acquisition of Dobson Communications Corporation.
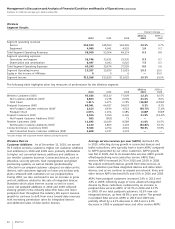
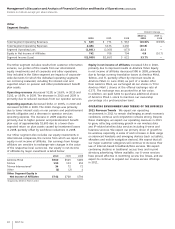
Service revenues are comprised of local voice and data
services, roaming, long-distance and other revenue. Service
revenues increased $4,947, or 10.2%, in 2010 and $4,314, or
9.7%, in 2009. The increases for these periods consisted of
the following:
•Dataservicerevenuesincreased$4,052,or28.7%,in
2010 and $3,539, or 33.4%, in 2009. The increases were
primarily due to the increased number of subscribers
and heavier text and multimedia messaging and Internet
access by subscribers using integrated devices and
other data-centric devices, such as eReaders, tablets,
and mobile navigation devices. Data service revenues
represented 34.0% of our Wireless segment service
revenues in 2010, an increase from 29.1% in 2009,
and 23.9% in 2008.
•Voiceandotherservicerevenuesincreased$895,or
2.6%, in 2010 and $775, or 2.3%, in 2009. The increases
were due to an 11.1% increase in the average number of
wireless customers in 2010 and a 9.4% increase in 2009,
partially offset by declining ARPU for these services in
both periods.
Equipment revenues increased $49, or 1.0%, in 2010 and $16,
or 0.3%, in 2009. In both periods, higher sales and upgrades
of postpaid integrated devices exceeded lower traditional
handset devices in connection with promotions.
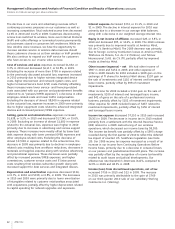
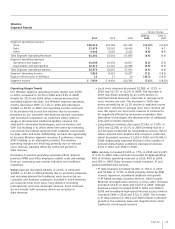
Operations and support expenses increased $3,115, or 9.3%,
in 2010 and $2,101, or 6.7%, in 2009. The increase in 2010
was primarily due to the following:
•Equipmentcostsincreased$1,340andcommission
expenses increased $132 driven by record integrated
device sales and upgrades.
•Interconnect,USFandnetworksystemcostsincreased
$1,103 due to higher network traffic, network
enhancement efforts, revenue growth and a USF
rate increase.
•Sellingexpenses(otherthancommissions)increased
$554, primarily due to increased advertising.
•Administrativeexpensesincreased$432duein
part to higher leasing, legal, and benefits costs.
These increases were partially offset by bad debt expense and
customer service cost decreases, totaling $353, and reseller
service costs and long-distance cost decreases, totaling $93,
due to lower usage.