AT&T Wireless 2010 Annual Report Download - page 61
Download and view the complete annual report
Please find page 61 of the 2010 AT&T Wireless annual report below. You can navigate through the pages in the report by either clicking on the pages listed below, or by using the keyword search tool below to find specific information within the annual report.-
 1
1 -
2
-
3
-
4
-
5
-
6
-
7
-
8
-
9
-
10
-
11
-
12
-
13
-
14
-
15
-
16
-
17
-
18
-
19
-
20
-
21
-
22
-
23
-
24
-
25
-
26
-
27
-
28
-
29
-
30
-
31
-
32
-
33
-
34
-
35
-
36
-
37
-
38
-
39
-
40
-
41
-
42
-
43
-
44
-
45
-
46
-
47
-
48
-
49
-
50
-
 51
51 -
 52
52 -
 53
53 -
 54
54 -
 55
55 -
 56
56 -
 57
57 -
 58
58 -
 59
59 -
 60
60 -
 61
61 -
 62
62 -
 63
63 -
 64
64 -
 65
65 -
 66
66 -
 67
67 -
 68
68 -
 69
69 -
 70
70 -
 71
71 -
72
-
73
-
74
-
75
-
76
-
77
-
78
-
79
-
80
-
81
-
82
-
83
-
84
-
85
-
86
-
87
-
88
-
89
-
90
-
91
-
92
-
93
-
94
-
95
-
96
-
97
-
98
-
99
-
100
-
101
-
102
-
103
-
104
 |
 |

AT&T Inc. 59
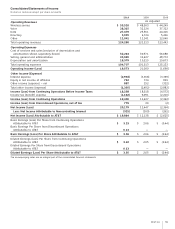
Consolidated Statements of Income
Dollars in millions except per share amounts
2010 2009 2008
Operating Revenues As Adjusted
Wireless service $ 53,510 $ 48,563 $ 44,249
Voice 28,315 32,324 37,322
Data 27,479 25,561 24,416
Directory 3,935 4,724 5,416
Other 11,041 11,341 12,040
Total operating revenues 124,280 122,513 123,443
Operating Expenses
Cost of services and sales (exclusive of depreciation and
amortization shown separately below) 52,263 50,571 56,688
Selling, general and administrative 33,065 31,427 48,772
Depreciation and amortization 19,379 19,515 19,673
Total operating expenses 104,707 101,513 125,133
Operating Income (Loss) 19,573 21,000 (1,690)
Other Income (Expense)
Interest expense (2,994) (3,368) (3,369)
Equity in net income of affiliates 762 734 819
Other income (expense) – net 897 152 (332)
Total other income (expense) (1,335) (2,482) (2,882)
Income (Loss) from Continuing Operations Before Income Taxes 18,238 18,518 (4,572)
Income tax (benefit) expense (1,162) 6,091 (2,210)
Income (Loss) from Continuing Operations 19,400 12,427 (2,362)
Income (Loss) from Discontinued Operations, net of tax 779 20 (2)
Net Income (Loss) 20,179 12,447 (2,364)
Less: Net Income Attributable to Noncontrolling Interest (315) (309) (261)
Net Income (Loss) Attributable to AT&T $ 19,864 $ 12,138 $ (2,625)
Basic Earnings (Loss) Per Share from Continuing Operations
Attributable to AT&T $ 3.23 $ 2.06 $ (0.44)
Basic Earnings Per Share from Discontinued Operations
Attributable to AT&T 0.13 — —
Basic Earnings (Loss) Per Share Attributable to AT&T $ 3.36 $ 2.06 $ (0.44)
Diluted Earnings (Loss) Per Share from Continuing Operations
Attributable to AT&T $ 3.22 $ 2.05 $ (0.44)
Diluted Earnings Per Share from Discontinued Operations
Attributable to AT&T 0.13 — —
Diluted Earnings (Loss) Per Share Attributable to AT&T $ 3.35 $ 2.05 $ (0.44)
The accompanying notes are an integral part of the consolidated financial statements.