AT&T Wireless 2010 Annual Report Download - page 42
Download and view the complete annual report
Please find page 42 of the 2010 AT&T Wireless annual report below. You can navigate through the pages in the report by either clicking on the pages listed below, or by using the keyword search tool below to find specific information within the annual report.-
 1
1 -
2
-
3
-
4
-
5
-
6
-
7
-
8
-
9
-
10
-
11
-
12
-
13
-
14
-
15
-
16
-
17
-
18
-
19
-
20
-
21
-
22
-
23
-
24
-
25
-
26
-
27
-
28
-
29
-
30
-
31
-
 32
32 -
 33
33 -
 34
34 -
 35
35 -
 36
36 -
 37
37 -
 38
38 -
 39
39 -
 40
40 -
 41
41 -
 42
42 -
 43
43 -
 44
44 -
 45
45 -
 46
46 -
 47
47 -
 48
48 -
 49
49 -
 50
50 -
 51
51 -
 52
52 -
53
-
54
-
55
-
56
-
57
-
58
-
59
-
60
-
61
-
62
-
63
-
64
-
65
-
66
-
67
-
68
-
69
-
70
-
71
-
72
-
73
-
74
-
75
-
76
-
77
-
78
-
79
-
80
-
81
-
82
-
83
-
84
-
85
-
86
-
87
-
88
-
89
-
90
-
91
-
92
-
93
-
94
-
95
-
96
-
97
-
98
-
99
-
100
-
101
-
102
-
103
-
104
 |
 |

Management’s Discussion and Analysis of Financial Condition and Results of Operations (continued)
Dollars in millions except per share amounts
40 AT&T Inc.
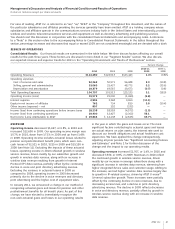
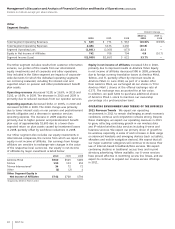
Equity in net income of affiliates increased $34 in 2010,
primarily due to improved results at América Móvil. Equity
in net income of affiliates decreased $86 in 2009, primarily
due to foreign currency translation losses at América Móvil,
Telmex, and TI, partially offset by improved results at
América Móvil. In June 2010, as part of a tender offer
from América Móvil, we exchanged all our shares in TI for
América Móvil L shares at the offered exchange rate of
0.373. The exchange was accounted for at fair value.
In addition, we paid $202 to purchase additional shares
of América Móvil L stock to maintain our ownership
percentage at a pretransaction level.
OPERATING ENVIRONMENT AND TRENDS OF THE BUSINESS
2011 Revenue Trends We expect our operating
environment in 2011 to remain challenging as weak economic
conditions continue and competition remains strong. Despite
these challenges, we expect our operating revenues in 2011
to grow, reflecting continuing growth in our wireless data
and IP-related wireline data services including U-verse and
business services. We expect our primary driver of growth to
be wireless, especially in sales of and increases in data usage
on advanced handsets and emerging devices (such as tablets,
eReaders and mobile navigation devices). We expect that all
our major customer categories will continue to increase their
use of Internet-based broadband/data services. We expect
continuing declines in traditional access lines and in print
directory advertising. Where available, our U-verse services
have proved effective in stemming access line losses, and we
expect to continue to expand our U-verse service offerings
in 2011.
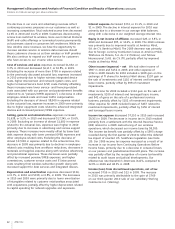
The Other segment includes results from customer information
services, our portion of the results from our international
equity investments and all corporate and other operations.
Also included in the Other segment are impacts of corporate-
wide decisions for which the individual operating segments
are not being evaluated, including the interest cost and
expected return on pension and other postretirement benefit
plan assets.
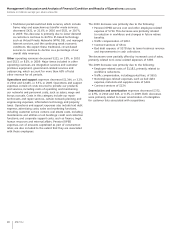
Operating revenues decreased $128, or 16.6%, in 2010 and
$192, or 19.9%, in 2009. The decrease in 2010 and 2009 is
primarily due to reduced revenues from our operator services.
Operating expenses decreased $652, or 20.8%, in 2010 and
increased $2,000 in 2009. The 2010 change was primarily
due to lower interest costs on our pension and postretirement
benefit obligation and a decrease in operator services
operating expense. The increase in 2009 expense was
primarily due to higher pension and postretirement benefit
plan cost of approximately $2,600 due to a lower-than-
expected return on plan assets caused by investment losses
in 2008, partially offset by workforce reductions in 2008.
Our Other segment also includes our equity investments in
international companies, the income from which we report as
equity in net income of affiliates. Our earnings from foreign
affiliates are sensitive to exchange-rate changes in the value
of the respective local currencies. Our equity in net income
of affiliates by major investment is listed below:
2010 2009 2008
América Móvil $560 $505 $469
Telmex 150 133 252
Telmex Internacional1 34 72 72
Other (2) (2) 1
Other Segment Equity in
Net Income of Affiliates $742 $708 $794
1Acquired by América Móvil in 2010.
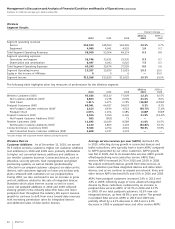
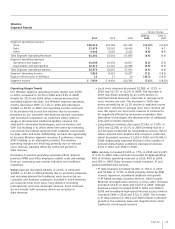
Other
Segment Results
Percent Change
2010 vs. 2009 vs.
2010 2009 2008 2009 2008
Total Segment Operating Revenues $ 643 $ 771 $ 963 (16.6)% (19.9)%
Total Segment Operating Expenses 2,484 3,136 1,136 (20.8) —
Segment Operating Loss (1,841) (2,365) (173) 22.2 —
Equity in Net Income of Affiliates 742 708 794 4.8 (10.7)
Segment Income (Loss) $(1,099) $(1,657) $ 621 33.7% —