AT&T Wireless 2010 Annual Report Download - page 93
Download and view the complete annual report
Please find page 93 of the 2010 AT&T Wireless annual report below. You can navigate through the pages in the report by either clicking on the pages listed below, or by using the keyword search tool below to find specific information within the annual report.-
 1
1 -
2
-
3
-
4
-
5
-
6
-
7
-
8
-
9
-
10
-
11
-
12
-
13
-
14
-
15
-
16
-
17
-
18
-
19
-
20
-
21
-
22
-
23
-
24
-
25
-
26
-
27
-
28
-
29
-
30
-
31
-
32
-
33
-
34
-
35
-
36
-
37
-
38
-
39
-
40
-
41
-
42
-
43
-
44
-
45
-
46
-
47
-
48
-
49
-
50
-
51
-
52
-
53
-
54
-
55
-
56
-
57
-
58
-
59
-
60
-
61
-
62
-
63
-
64
-
65
-
66
-
67
-
68
-
69
-
70
-
71
-
72
-
73
-
74
-
75
-
76
-
77
-
78
-
79
-
80
-
81
-
82
-
 83
83 -
 84
84 -
 85
85 -
 86
86 -
 87
87 -
 88
88 -
 89
89 -
 90
90 -
 91
91 -
 92
92 -
 93
93 -
 94
94 -
 95
95 -
 96
96 -
 97
97 -
 98
98 -
 99
99 -
 100
100 -
 101
101 -
 102
102 -
 103
103 -
104
 |
 |

AT&T Inc. 91
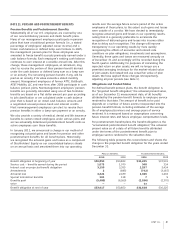
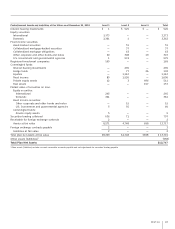
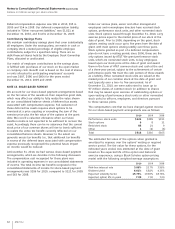
The table below sets forth a summary of changes in the fair value of the Level 3 pension and postretirement assets for the year
ended December 31, 2009:
Fixed Private
Equities- Income Hedge Equity Real
Pension Assets Domestic Funds Funds Funds Assets Total
Balance, beginning of year $ 1 $ 248 $114 $5,152 $ 5,281 $10,796
Realized gains (losses) — 19 — 97 (47) 69
Unrealized gains (losses) (1) (7) — (582) (1,613) (2,203)
Purchases, sales, issuances and settlements (net) 1 77 (12) 207 (324) (51)
Balance, end of year $ 1 $337 $102 $4,874 $ 3,297 $ 8,611
Fixed Private
Equity Income Hedge Equity Real
Postretirement Assets Securities Securities Funds Assets Assets Total
Balance, beginning of year $ 6 $ — $55 $553 $265 $879
Realized gains (losses) — — — 23 (34) (11)
Unrealized gains (losses) — — — (74) (64) (138)
Purchases, sales, issuances and settlements (net) (6) 19 17 (22) 4 12
Balance, end of year $— $19 $72 $480 $171 $742
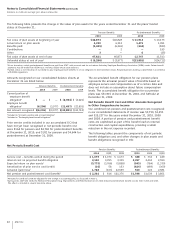
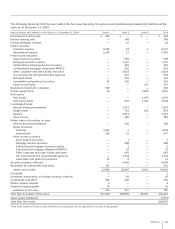
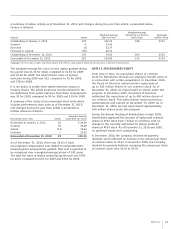
The following table provides information for our supplemental
retirement plans with accumulated benefit obligations in
excess of plan assets:
2010 2009
Projected benefit obligation $(2,270) $(2,139)
Accumulated benefit obligation (2,154) (2,058)
Fair value of plan assets — —
The following tables present the components of net periodic
benefit cost and other changes in plan assets and benefit
obligations recognized in OCI:
Net Periodic Benefit Cost 2010 2009 2008
Service cost – benefits earned
during the period $ 12 $ 11 $ 13
Interest cost on projected
benefit obligation 134 140 141
Amortization of prior service cost 2 5 6
Actuarial (gain) loss1 186 82 (104)
Net supplemental retirement
pension cost $334 $238 $ 56
1
Amounts for 2008 and 2009 are adjusted for the change in accounting policy as
discussed in Note 1.
Other Changes Recognized in
Other Comprehensive Income 2010 2009
Prior service cost (credit) $(5) $(5)
Reversal of amortization of
prior service cost (2) (3)
Total recognized in other
comprehensive income $(7) $(8)
The estimated prior service cost for our supplemental
retirement plan benefits that will be amortized from
accumulated OCI into net periodic benefit cost over the
next fiscal year is $2.
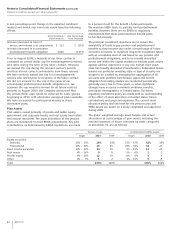
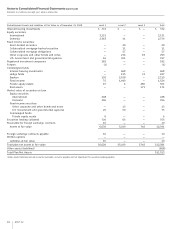
Estimated Future Benefit Payments
Expected benefit payments are estimated using the same
assumptions used in determining our benefit obligation at
December 31, 2010. Because benefit payments will depend
on future employment and compensation levels, average
years employed and average life spans, among other factors,
changes in any of these factors could significantly affect these
expected amounts. The following table provides expected
benefit payments under our pension and postretirement plans:
Medicare
Pension Postretirement Subsidy
Benefits Benefits Receipts
2011 $ 5,912 $ 2,594 $(114)
2012 6,191 2,558 (124)
2013 4,008 2,546 (134)
2014 4,002 2,483 (144)
2015 4,025 2,430 (154)
Years 2016 – 2020 20,211 11,874 (926)
Supplemental Retirement Plans
We also provide certain senior- and middle-management
employees with nonqualified, unfunded supplemental
retirement and savings plans. While these plans are unfunded,
we have assets in a designated nonbankruptcy remote trust
that are independently managed and used to provide for
these benefits. These plans include supplemental pension
benefits as well as compensation-deferral plans, some of
which include a corresponding match by us based on a
percentage of the compensation deferral.
We use the same significant assumptions for the discount
rate and composite rate of compensation increase used in
determining the projected benefit obligation and the net
pension and postemployment benefit cost. The following
tables provide the plans’ benefit obligations and fair value
of assets at December 31 and the components of the
supplemental retirement pension benefit cost. The net amount
recorded as “Other noncurrent liabilities” on our consolidated
balance sheets at December 31, 2010, was $2,270 and $2,139
at December 31, 2009.