AT&T Wireless 2010 Annual Report Download - page 34
Download and view the complete annual report
Please find page 34 of the 2010 AT&T Wireless annual report below. You can navigate through the pages in the report by either clicking on the pages listed below, or by using the keyword search tool below to find specific information within the annual report.-
 1
1 -
2
-
3
-
4
-
5
-
6
-
7
-
8
-
9
-
10
-
11
-
12
-
13
-
14
-
15
-
16
-
17
-
18
-
19
-
20
-
21
-
22
-
23
-
 24
24 -
 25
25 -
 26
26 -
 27
27 -
 28
28 -
 29
29 -
 30
30 -
 31
31 -
 32
32 -
 33
33 -
 34
34 -
 35
35 -
 36
36 -
 37
37 -
 38
38 -
 39
39 -
 40
40 -
 41
41 -
 42
42 -
 43
43 -
 44
44 -
45
-
46
-
47
-
48
-
49
-
50
-
51
-
52
-
53
-
54
-
55
-
56
-
57
-
58
-
59
-
60
-
61
-
62
-
63
-
64
-
65
-
66
-
67
-
68
-
69
-
70
-
71
-
72
-
73
-
74
-
75
-
76
-
77
-
78
-
79
-
80
-
81
-
82
-
83
-
84
-
85
-
86
-
87
-
88
-
89
-
90
-
91
-
92
-
93
-
94
-
95
-
96
-
97
-
98
-
99
-
100
-
101
-
102
-
103
-
104
 |
 |

Management’s Discussion and Analysis of Financial Condition and Results of Operations (continued)
Dollars in millions except per share amounts
32 AT&T Inc.
Interest expense decreased $374, or 11.1%, in 2010 and
$1 in 2009. The decline in interest expense for 2010 was
primarily due to a decrease in our average debt balances,
along with a decrease in our weighted average interest rate.
Equity in net income of affiliates increased $28, or 3.8%, in
2010 and decreased $85, or 10.4%, in 2009. The 2010 increase
was primarily due to improved results at América Móvil,
S.A. de C.V. (América Móvil). The 2009 decrease was primarily
due to foreign currency translation losses at América Móvil,
Télefonos de México, S.A. de C.V. (Telmex), and Telmex
Internacional, S.A.B. de C.V. (TI), partially offset by improved
results at América Móvil.
Other income (expense) – net We had other income of
$897 in 2010 and $152 in 2009, and other expense of
$332 in 2008. Results for 2010 included a $658 gain on the
exchange of TI shares for América Móvil shares, $197 gain on
the sale of investments and $110 of interest and leveraged
lease income, partially offset by $98 of investment
impairments.
Other income for 2009 included a $112 gain on the sale of
investments, $100 of interest and leveraged lease income,
and $42 of gains on the sale of a professional services
business, partially offset by $102 of investment impairments.
Other expense for 2008 included losses of $467 related to
investment impairments, partially offset by $156 of interest
and leveraged lease income.
Income tax expense decreased $7,253 in 2010 and increased
$8,301 in 2009. The decrease in income tax in 2010 resulted
primarily from a settlement with the Internal Revenue Service
(IRS) related to a 2008 restructuring of our wireless
operations, which decreased our income taxes by $8,300.
This income tax benefit was partially offset by a $995 charge
recorded during the first quarter of 2010 to reflect the deferred
tax impact of enacted U.S. healthcare legislation (see Note
10). Our 2009 income tax expense increased as a result of an
increase in our Income from Continuing Operations Before
Income Taxes, primarily due to a decrease in actuarial losses
on our pension and postretirement benefit plans. This increase
was partially offset by the recognition of income tax benefits
related to audit issues and judicial developments. Our
effective tax rate (benefit) in 2010 was (6.4)%, compared to
32.9% in 2009 and 48.3% in 2008.
Income (loss) from discontinued operations, net of tax
increased $759 in 2010 and $22 in 2009. The increase
in 2010 was primarily attributable to the gain of $769
on our third-quarter 2010 sale of our subsidiary Sterling
Commerce Inc. (Sterling).
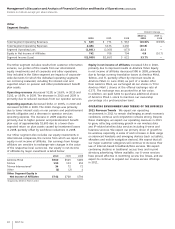
The declines in our voice and advertising revenues reflect
continuing economic pressures on our customers as well as
increasing competition. Total switched access lines decreased
11.6% in 2010 and 11.2% in 2009. Customers disconnecting
access lines switched to wireless, Voice over Internet Protocol
(VoIP) and cable offerings or terminated service permanently
as businesses closed or consumers left residences. While we
lose wireline voice revenues, we have the opportunity to
increase wireless service or wireline data revenues should
these customers choose us as their wireless or VoIP provider.
We also continue to expand our VoIP service for customers
who have access to our U-verse video service.
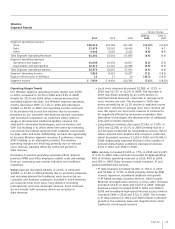
Cost of services and sales expenses increased $1,692, or
3.3%, in 2010 and decreased $6,117, or 10.8%, in 2009.
Excluding the increase of more than $700 in expense related
to the previously discussed actuarial loss, expenses increased
in 2010 primarily due to higher wireless integrated device
costs, higher interconnect and network system costs, and
higher Universal Service Fund (USF) costs. Partially offsetting
these increases were lower service- and financing-related
costs associated with our pension and postretirement benefits
(referred to as “pension/OPEB expenses”), a decrease in other
employee-related costs and lower traffic compensation.
Excluding the decrease of almost $8,000 in expense related
to the actuarial loss, expense increases in 2009 were primarily
due to higher equipment costs related to advanced integrated
devices and increased pension/OPEB expenses.
Selling, general and administrative expenses increased
$1,638, or 5.2%, in 2010 and decreased $17,345, or 35.6%,
in 2009. Excluding an increase of almost $1,600 in expense
related to the actuarial loss, expenses were higher in 2010
primarily due to increases in advertising and various support
expenses. These increases were mostly offset by lower bad
debt expense along with lower pension/OPEB expenses and
other employee-related costs. Excluding the decrease of
almost $17,000 in expense related to the actuarial loss, the
decrease in 2009 was primarily due to declines in employee-
related costs resulting from workforce reductions, decreases in
materials and supplies expense along with wireless advertising
and promotional expenses. These decreases were partially
offset by increased pension/OPEB expenses, and higher
commissions, customer service costs and IT/interconnect
costs resulting from wireless subscriber growth along with
increased support for data services and integrated devices.
Depreciation and amortization expenses decreased $136,
or 0.7%, in 2010 and $158, or 0.8%, in 2009. The decreases
in 2010 and 2009 were primarily due to lower amortization
of intangibles related to customer relationships associated
with acquisitions, partially offset by higher depreciation related
to capital spending for network upgrades and expansion.