AT&T Wireless 2010 Annual Report Download - page 88
Download and view the complete annual report
Please find page 88 of the 2010 AT&T Wireless annual report below. You can navigate through the pages in the report by either clicking on the pages listed below, or by using the keyword search tool below to find specific information within the annual report.-
 1
1 -
2
-
3
-
4
-
5
-
6
-
7
-
8
-
9
-
10
-
11
-
12
-
13
-
14
-
15
-
16
-
17
-
18
-
19
-
20
-
21
-
22
-
23
-
24
-
25
-
26
-
27
-
28
-
29
-
30
-
31
-
32
-
33
-
34
-
35
-
36
-
37
-
38
-
39
-
40
-
41
-
42
-
43
-
44
-
45
-
46
-
47
-
48
-
49
-
50
-
51
-
52
-
53
-
54
-
55
-
56
-
57
-
58
-
59
-
60
-
61
-
62
-
63
-
64
-
65
-
66
-
67
-
68
-
69
-
70
-
71
-
72
-
73
-
74
-
75
-
76
-
77
-
 78
78 -
 79
79 -
 80
80 -
 81
81 -
 82
82 -
 83
83 -
 84
84 -
 85
85 -
 86
86 -
 87
87 -
 88
88 -
 89
89 -
 90
90 -
 91
91 -
 92
92 -
 93
93 -
 94
94 -
 95
95 -
 96
96 -
 97
97 -
 98
98 -
99
-
100
-
101
-
102
-
103
-
104
 |
 |

Notes to Consolidated Financial Statements (continued)
Dollars in millions except per share amounts
86 AT&T Inc.
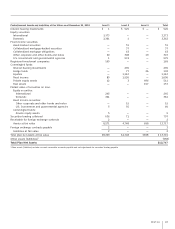
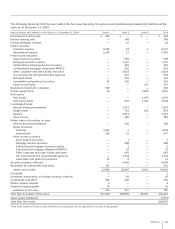
The following table sets forth by level, within the fair value hierarchy, the pension and postretirement assets and liabilities at fair
value as of December31, 2010:
Pension Assets and Liabilities at Fair Value as of December 31, 2010 Level 1 Level 2 Level 3 Total
Non-interest bearing cash $ 100 $ — $ — $ 100
Interest bearing cash — 74 — 74
Foreign exchange contract — 57 — 57
Equity securities:
Domestic equities 9,692 16 — 9,708
International equities 4,960 4 — 4,964
Fixed income securities:
Asset-backed securities — 730 6 736
Mortgage-backed securities — 2,744 — 2,744
Collateralized mortgage-backed securities — 335 — 335
Collateralized mortgage obligations/REMICS — 565 — 565
Other corporate and other bonds and notes 430 4,637 — 5,067
U.S. Government and governmental agencies — 1,831 — 1,831
Municipal bonds — 233 — 233
Convertible and preferred securities 87 204 — 291
Fixed income funds — — 377 377
Registered investment companies — 1 — 1
Private equity funds 35 1 5,821 5,857
Real assets:
Real assets — — 2,383 2,383
Real estate funds — 448 1,545 1,993
Commingled funds:
Interest bearing investments — 2,351 — 2,351
Hedge funds — 831 50 881
Equities — 1,769 — 1,769
Fixed income — 1,101 — 1,101
Market value of securities on loan:
Interest bearing investments — 209 — 209
Equity securities:
Domestic 2,113 20 — 2,133
International 320 — — 320
Fixed income securities:
Asset-backed securities — 9 — 9
Mortgage-backed securities — 24 — 24
Collateralized mortgage-backed securities — 8 — 8
Other corporate and other bonds and notes 42 763 — 805
U.S. Government and governmental agencies — 2,028 — 2,028
Convertible and preferred securities 12 16 — 28
Securities lending collateral 2,558 3,110 — 5,668
Variation margin receivable 3 — — 3
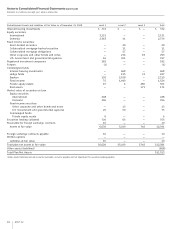
Assets at fair value 20,352 24,119 10,182 54,653
Overdrafts 3 4 — 7
Unrealized depreciation on foreign currency contracts — 57 — 57
Investments sold short 405 24 140 569
Written options payable 1 — — 1
Liabilities at fair value 409 85 140 634
Total plan net assets at fair value $19,943 $24,034 $10,042 $ 54,019
Other assets (liabilities)1 (6,398)
Total Plan Net Assets $47,621
1Other assets (liabilities) include accounts receivable, accounts payable and net adjustment for securities lending payable.