AT&T Wireless 2010 Annual Report Download - page 56
Download and view the complete annual report
Please find page 56 of the 2010 AT&T Wireless annual report below. You can navigate through the pages in the report by either clicking on the pages listed below, or by using the keyword search tool below to find specific information within the annual report.-
 1
1 -
2
-
3
-
4
-
5
-
6
-
7
-
8
-
9
-
10
-
11
-
12
-
13
-
14
-
15
-
16
-
17
-
18
-
19
-
20
-
21
-
22
-
23
-
24
-
25
-
26
-
27
-
28
-
29
-
30
-
31
-
32
-
33
-
34
-
35
-
36
-
37
-
38
-
39
-
40
-
41
-
42
-
43
-
44
-
45
-
 46
46 -
 47
47 -
 48
48 -
 49
49 -
 50
50 -
 51
51 -
 52
52 -
 53
53 -
 54
54 -
 55
55 -
 56
56 -
 57
57 -
 58
58 -
 59
59 -
 60
60 -
 61
61 -
 62
62 -
 63
63 -
 64
64 -
 65
65 -
 66
66 -
67
-
68
-
69
-
70
-
71
-
72
-
73
-
74
-
75
-
76
-
77
-
78
-
79
-
80
-
81
-
82
-
83
-
84
-
85
-
86
-
87
-
88
-
89
-
90
-
91
-
92
-
93
-
94
-
95
-
96
-
97
-
98
-
99
-
100
-
101
-
102
-
103
-
104
 |
 |
Management’s Discussion and Analysis of Financial Condition and Results of Operations (continued)
Dollars in millions except per share amounts
54 AT&T Inc.
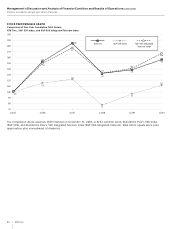
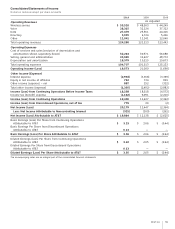
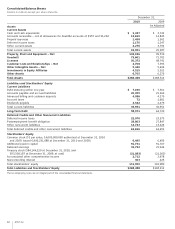
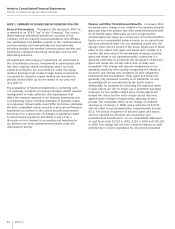
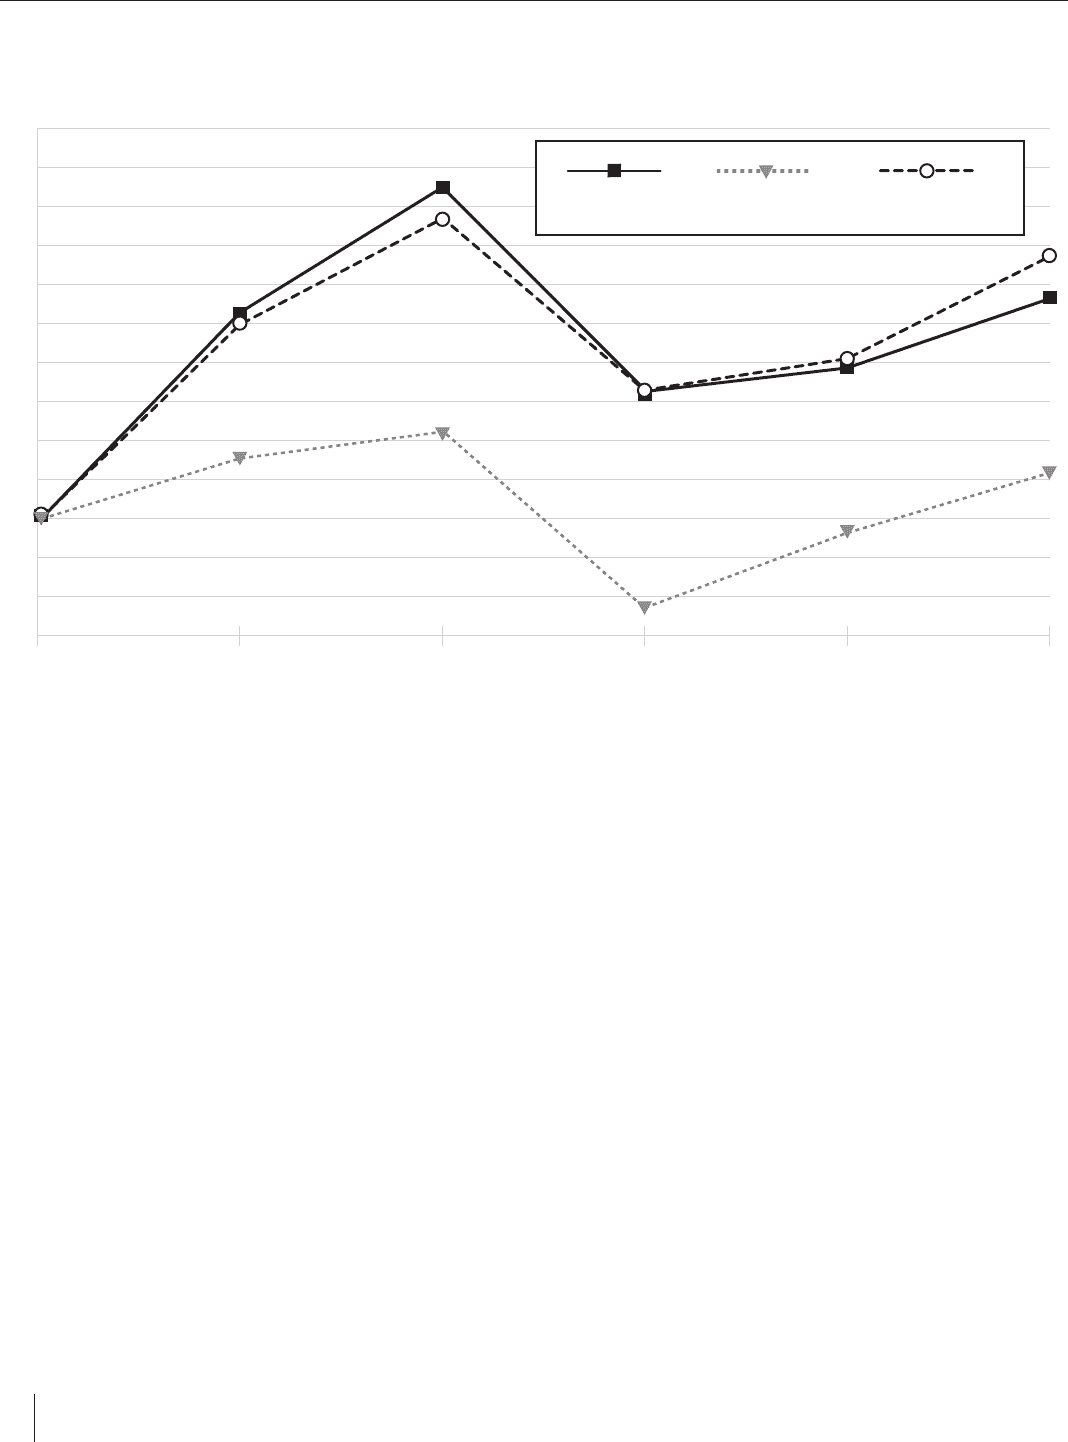
STOCK PERFORMANCE GRAPH
Comparison of Five Year Cumulative Total Return
AT&T Inc., S&P 500 Index, and S&P 500 Integrated Telecom Index
200
190
180
170
160
150
140
130
120
110
100
90
80
70
12/05 12/06 12/07 12/08 12/09 12/10
100
116
S&P 500 Integrated
Telecom Index
AT&T Inc. S&P 500 Index
122
77
97
112
150
177
133 139
156
153
185
141
168
133
The comparison above assumes $100 invested on December 31, 2005, in AT&T common stock, Standard & Poor’s 500 Index
(S&P 500), and Standard & Poor’s 500 Integrated Telecom Index (S&P 500 Integrated Telecom). Total return equals stock price
appreciation plus reinvestment of dividends.