AT&T Wireless 2010 Annual Report Download - page 39
Download and view the complete annual report
Please find page 39 of the 2010 AT&T Wireless annual report below. You can navigate through the pages in the report by either clicking on the pages listed below, or by using the keyword search tool below to find specific information within the annual report.-
 1
1 -
2
-
3
-
4
-
5
-
6
-
7
-
8
-
9
-
10
-
11
-
12
-
13
-
14
-
15
-
16
-
17
-
18
-
19
-
20
-
21
-
22
-
23
-
24
-
25
-
26
-
27
-
28
-
 29
29 -
 30
30 -
 31
31 -
 32
32 -
 33
33 -
 34
34 -
 35
35 -
 36
36 -
 37
37 -
 38
38 -
 39
39 -
 40
40 -
 41
41 -
 42
42 -
 43
43 -
 44
44 -
 45
45 -
 46
46 -
 47
47 -
 48
48 -
 49
49 -
50
-
51
-
52
-
53
-
54
-
55
-
56
-
57
-
58
-
59
-
60
-
61
-
62
-
63
-
64
-
65
-
66
-
67
-
68
-
69
-
70
-
71
-
72
-
73
-
74
-
75
-
76
-
77
-
78
-
79
-
80
-
81
-
82
-
83
-
84
-
85
-
86
-
87
-
88
-
89
-
90
-
91
-
92
-
93
-
94
-
95
-
96
-
97
-
98
-
99
-
100
-
101
-
102
-
103
-
104
 |
 |

AT&T Inc. 37
•Localvoicerevenuesdecreased$2,280,or11.5%,in
2010 and $2,737, or 12.2%, in 2009. The decrease in
2010 was driven primarily by an 11.6% decline in
switched access lines and a decrease in average local
voice revenue per user. The decrease in 2009 was
driven primarily by an 11.2% decline in switched access
lines and a decrease in average local voice revenue per
user. We expect our local voice revenue to continue to
be negatively affected by increased competition from
alternative technologies, the disconnection of additional
lines and economic pressures.
•Long-distancerevenuesdecreased$1,562,or13.9%,in
2010 and $2,036, or 15.3%, in 2009 primarily due to a
net decrease in demand for long-distance service, due to
slower demand from business and consumer customers,
which decreased revenues $1,239 in 2010 and $1,491 in
2009. Additionally, expected declines in the number of
national mass-market customers decreased revenues
$331 in 2010 and $546 in 2009.
Data revenues increased $1,918, or 7.5%, in 2010 and $1,145,
or 4.7%, in 2009. Data revenues accounted for approximately
45% of wireline operating revenues in 2010, 40% in 2009
and 36% in 2008. Data revenues include transport, IP and
packet-switched data services.
•IPdatarevenuesincreased$2,494,or19.1%,in2010
and $1,986, or 17.9%, in 2009 primarily driven by AT&T
U-verse expansion, broadband additions and growth
in IP-based strategic business services, which include
Ethernet and application services. U-verse video revenues
increased $1,227 in 2010 and $1,039 in 2009, strategic
business services increased $648 in 2010 and $582 in
2009 and broadband high-speed Internet access revenue
increased $446 in 2010 and $311 in 2009. The increase
in IP data revenues in 2010 and 2009 reflects continued
growth in the customer base and migration from other
traditional circuit-based services.
Operating Margin Trends
Our Wireline segment operating income margin was 12.8%
in 2010, compared to 13.3% in 2009 and 15.2% in 2008.
Results for 2010 and 2009 reflect revenue declines that
exceeded expense declines. Our Wireline segment operating
income decreased $596, or 7.1%, in 2010 and decreased
$1,868, or 18.2%, in 2009. Our operating income continued
to be pressured by access line declines due to economic
pressures on our consumer and business wireline customers
and increased competition, as customers either reduced
usage or disconnected traditional landline services and
switched to alternative technologies, such as wireless and
VoIP. Our strategy is to offset these line losses by increasing
non-access-line-related revenues from customer connections
for data, video and voice. Additionally, we have the opportunity
to increase Wireless segment revenues if customers choose
AT&T Mobility as an alternative provider. The wireline
operating margins are declining primarily due to reduced
voice revenue, partially offset by continued growth in
data revenue.
Decreases in wireline operating expenses reflect reduced
pension/OPEB and other employee-related costs and savings
from our continuing cost-control initiatives and workforce
reductions.
Voice revenues decreased $4,009, or 12.4%, in 2010 and
$4,998, or 13.4%, in 2009 primarily due to economic pressures
and declining demand for traditional voice services by our
consumer and business customers. Included in voice revenues
are revenues from local voice, long-distance (including
international) and local wholesale services. Voice revenues
do not include VoIP revenues, which are included in
data revenues.
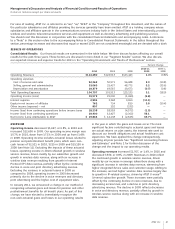
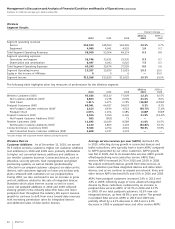
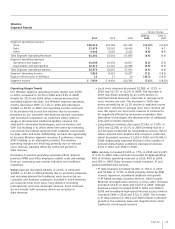
Wireline
Segment Results
Percent Change
2010 vs. 2009 vs.
2010 2009 2008 2009 2008
Segment operating revenues
Voice $28,315 $32,324 $37,322 (12.4)% (13.4)%
Data 27,479 25,561 24,416 7.5 4.7
Other 5,408 5,629 6,152 (3.9) (8.5)
Total Segment Operating Revenues 61,202 63,514 67,890 (3.6) (6.4)
Segment operating expenses
Operations and support 41,008 42,352 44,817 (3.2) (5.5)
Depreciation and amortization 12,371 12,743 12,786 (2.9) (0.3)
Total Segment Operating Expenses 53,379 55,095 57,603 (3.1) (4.4)
Segment Operating Income 7,823 8,419 10,287 (7.1) (18.2)
Equity in Net Income of Affiliates 11 17 19 (35.3) (10.5)
Segment Income $ 7,834 $ 8,436 $10,306 (7.1)% (18.1)%