AT&T Wireless 2010 Annual Report Download - page 51
Download and view the complete annual report
Please find page 51 of the 2010 AT&T Wireless annual report below. You can navigate through the pages in the report by either clicking on the pages listed below, or by using the keyword search tool below to find specific information within the annual report.-
 1
1 -
2
-
3
-
4
-
5
-
6
-
7
-
8
-
9
-
10
-
11
-
12
-
13
-
14
-
15
-
16
-
17
-
18
-
19
-
20
-
21
-
22
-
23
-
24
-
25
-
26
-
27
-
28
-
29
-
30
-
31
-
32
-
33
-
34
-
35
-
36
-
37
-
38
-
39
-
40
-
 41
41 -
 42
42 -
 43
43 -
 44
44 -
 45
45 -
 46
46 -
 47
47 -
 48
48 -
 49
49 -
 50
50 -
 51
51 -
 52
52 -
 53
53 -
 54
54 -
 55
55 -
 56
56 -
 57
57 -
 58
58 -
 59
59 -
 60
60 -
 61
61 -
62
-
63
-
64
-
65
-
66
-
67
-
68
-
69
-
70
-
71
-
72
-
73
-
74
-
75
-
76
-
77
-
78
-
79
-
80
-
81
-
82
-
83
-
84
-
85
-
86
-
87
-
88
-
89
-
90
-
91
-
92
-
93
-
94
-
95
-
96
-
97
-
98
-
99
-
100
-
101
-
102
-
103
-
104
 |
 |

AT&T Inc. 49
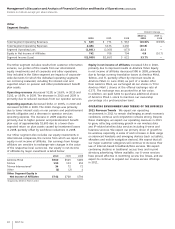
During 2009, cash provided by operating activities was
$34,405 compared to $33,610 in 2008. Our higher operating
cash flow reflected decreased tax payments of $836, partially
offset by increased interest payments of $157. During 2009,
our payments for income taxes were lower than 2008 due
primarily to changes in law impacting the timing of payments,
partially offset by an increase in audit-related payments net
of refunds.
Cash Used in or Provided by Investing Activities
During 2010, cash used in investing activities consisted of:
•$19,530incapitalexpenditures,excludinginterestduring
construction.
•$772ininterestduringconstruction.
•$2,376,netofcashacquired,relatedtotheacquisition
of various assets from Verizon.
•$265relatedtowirelessspectrumandlicensesacquired.
•$265relatedtootheracquisitions.
•$100fromthepurchaseofsecurities,netofinvestments.
During 2010, cash provided by investing activities consisted of:
•$1,830fromdispositionsofnon-strategicassets.
•$29relatedtootheractivities.
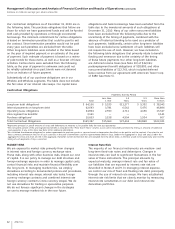
Our capital expenditures are primarily for our wireless and
wireline subsidiaries’ networks, our U-verse services, and
support systems for our communications services. Total capital
spending in 2010 was $19,530, which was a $2,976 increase
from 2009. Capital spending in our Wireless segment,
excluding interest during construction, represented 43%
of our total spending and increased over 50% from 2009.
Wireless expenditures were used for network capacity
expansion, integration and upgrades to our HSPA network
and the initial deployment of LTE (4G) equipment for trials.
Capital expenditures in our Wireline segment, which
represented 56% of our capital expenditures excluding
interest during construction, decreased 1% for 2010, reflecting
decreased spending on U-verse services, less spending on
wireline voice services, and lower DSL and High Capacity
volumes. The Other segment capital expenditures were less
than 1% of total capital expenditures for 2010. We expect to
fund any Advertising Solutions segment capital expenditures
using cash from operations. We expect total 2011 capital
investment to be in the low- to mid-$19,000 range.
We anticipate using approximately $1,925 of cash in 2011
to purchase wireless spectrum from Qualcomm.
Environmental We are subject from time to time to judicial
and administrative proceedings brought by various
governmental authorities under federal, state or local
environmental laws. Although we are required to reference
in our Forms 10-Q and 10-K any of these proceedings that
could result in monetary sanctions (exclusive of interest and
costs) of one hundred thousand dollars or more, we do not
believe that any of them currently pending will have a
material adverse effect on our results of operations.
LIQUIDITY AND CAPITAL RESOURCES
We had $1,437 in cash and cash equivalents available at
December 31, 2010. Cash and cash equivalents included
cash of $332 and money market funds and other cash
equivalents of $1,105. Cash and cash equivalents decreased
$2,304 since December 31, 2009. During 2010, cash inflows
were primarily provided by cash receipts from operations, the
issuance of debt and the disposition of non-strategic assets.
These inflows were more than offset by cash used to meet
the needs of the business including, but not limited to,
payment of operating expenses, funding capital expenditures,
dividends to stockholders, repayment of debt, payment of
interest on debt, and acquisitions. We discuss many of these
factors in detail below.
Cash Provided by or Used in Operating Activities
During 2010, cash provided by operating activities was
$34,993 compared to $34,405 in 2009. Our higher operating
cash flow reflects decreased tax payments of $933.
During 2010, our payments for current income taxes were
lower than 2009 due to lower audit-related payments net
of refunds. The timing of cash payments for income taxes is
governed by the IRS and other taxing authorities and differs
from the timing of recording tax expense.
In September 2010, we reached a settlement with the IRS
on the calculation of the tax basis of certain assets relating
to a restructuring of our wireless operations. The allowed
amortization deductions on these settlement-related assets
are expected to cover a 15-year period, which began in 2008.
As a result of this settlement, we paid $300 to the IRS during
the fourth quarter of 2010, representing the tax effect of
disallowed deductions taken on our federal income tax returns
in 2008 and 2009. We also decreased our net tax liabilities
approximately $8,300 and expect to recognize the cash flow
impacts of the settlement over a 15-year period, which began
in 2008. The effect of the change to our net tax liabilities was
recognized through our income statement in the third quarter
of 2010 as a reduction in income tax expense.