AT&T Wireless 2010 Annual Report Download - page 41
Download and view the complete annual report
Please find page 41 of the 2010 AT&T Wireless annual report below. You can navigate through the pages in the report by either clicking on the pages listed below, or by using the keyword search tool below to find specific information within the annual report.-
 1
1 -
2
-
3
-
4
-
5
-
6
-
7
-
8
-
9
-
10
-
11
-
12
-
13
-
14
-
15
-
16
-
17
-
18
-
19
-
20
-
21
-
22
-
23
-
24
-
25
-
26
-
27
-
28
-
29
-
30
-
 31
31 -
 32
32 -
 33
33 -
 34
34 -
 35
35 -
 36
36 -
 37
37 -
 38
38 -
 39
39 -
 40
40 -
 41
41 -
 42
42 -
 43
43 -
 44
44 -
 45
45 -
 46
46 -
 47
47 -
 48
48 -
 49
49 -
 50
50 -
 51
51 -
52
-
53
-
54
-
55
-
56
-
57
-
58
-
59
-
60
-
61
-
62
-
63
-
64
-
65
-
66
-
67
-
68
-
69
-
70
-
71
-
72
-
73
-
74
-
75
-
76
-
77
-
78
-
79
-
80
-
81
-
82
-
83
-
84
-
85
-
86
-
87
-
88
-
89
-
90
-
91
-
92
-
93
-
94
-
95
-
96
-
97
-
98
-
99
-
100
-
101
-
102
-
103
-
104
 |
 |

AT&T Inc. 39
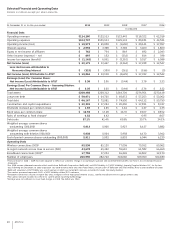
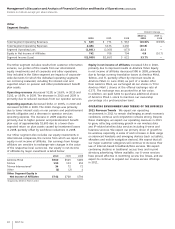
Supplemental Information
Telephone, Wired Broadband and Video Connections Summary Our switched access lines and other services provided by
our local exchange telephone subsidiaries at December 31, 2010, 2009 and 2008, are shown below and trends are addressed
throughout this segment discussion.
Percent Change
2010 vs. 2009 vs.
(in 000s) 2010 2009 2008 2009 2008
Switched Access Lines1
Retail consumer 22,515 26,378 30,614 (14.6)% (13.8)%
Retail business2 18,733 20,247 21,954 (7.5) (7.8)
Retail Subtotal2 41,248 46,625 52,568 (11.5) (11.3)
Wholesale Subtotal2 2,367 2,685 2,924 (11.8) (8.2)
Total Switched Access Lines3,7 43,678 49,392 55,610 (11.6) (11.2)
Total Retail Consumer Voice Connections6 24,195 27,332 30,838 (11.5) (11.4)
Total Wireline Broadband Connections4 16,310 15,789 15,077 3.3 4.7
Satellite service5 1,930 2,174 2,190 (11.2) (0.7)
U-verse video 2,987 2,065 1,045 44.6 97.6
Video Connections 4,917 4,239 3,235 16.0% 31.0%
1 Represents access lines served by AT&T’s Incumbent Local Exchange Carriers (ILECs) and affiliates.
2Prior-period amounts restated to conform to current period reporting methodology.
3Total switched access lines includes payphone access lines of 63 at December 31, 2010, 82 at December 31, 2009 and 118 at December 31, 2008.
4Total wireline broadband connections include DSL, U-verse High Speed Internet and satellite broadband.
5Satellite service includes connections under our agency and resale agreements.
6Includes consumer U-verse VoIP connections of 1,680 at December 31, 2010, 954 at December 31, 2009 and 224 at December 31, 2008.
7 Total switched access lines that are used solely by AT&T or our subsidiaries include 1,699 retail business and 95 wholesale lines at December 31, 2010, 1,750 retail business
and 106 wholesale lines at December 31, 2009, and 1,879 retail business and 125 wholesale lines at December 31, 2008.
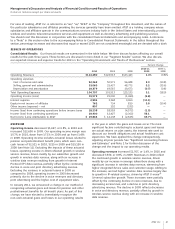
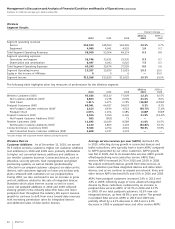
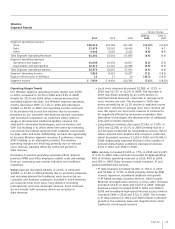
Advertising Solutions
Segment Results
Percent Change
2010 vs. 2009 vs.
2010 2009 2008 2009 2008
Total Segment Operating Revenues $3,935 $4,724 $5,416 (16.7)% (12.8)%
Segment operating expenses
Operations and support 2,583 2,743 2,900 (5.8) (5.4)
Depreciation and amortization 497 650 789 (23.5) (17.6)
Total Segment Operating Expenses 3,080 3,393 3,689 (9.2) (8.0)
Segment Income $ 855 $1,331 $1,727 (35.8)% (22.9)%
revenues of $34, partially offset by interactive advertising
revenue growth of $132. The current weak economy has
reduced demand for advertising, and customers have
continued to shift to Internet-based search services.
Operating expenses decreased $313, or 9.2%, in 2010 and
$296, or 8.0%, in 2009. The 2010 decrease was largely
driven by decreases in depreciation and amortization expense
of $136 resulting from use of an accelerated method of
amortization for customer lists, employee-related costs of $99,
and bad debt expense of $34. The 2009 decrease was due to
decreased depreciation and amortization expenses of $139,
product-related costs of $92, advertising costs of $44 and
professional contracted expenses of $17.
Operating Results
Our Advertising Solutions segment operating income margin
was 21.7% in 2010, 28.2% in 2009 and 31.9% in 2008.
The decrease in the segment operating income margin in
both 2010 and 2009 was primarily the result of decreased
operating revenues.
Operating revenues decreased $789, or 16.7%, in 2010 and
$692, or 12.8%, in 2009. The decrease in 2010 was largely
driven by continuing declines in print revenue of $858, as
customers reduced or eliminated print ad purchases due to
the slow economy, partially offset by increased interactive
revenue of $77, as customers purchased more electronic
advertising. The decrease in 2009 was primarily due to
declines in print revenue of $774 and lower sales agency