Westjet 2013 Annual Report Download - page 91
Download and view the complete annual report
Please find page 91 of the 2013 Westjet annual report below. You can navigate through the pages in the report by either clicking on the pages listed below, or by using the keyword search tool below to find specific information within the annual report.-
 1
1 -
2
-
3
-
4
-
5
-
6
-
7
-
8
-
9
-
10
-
11
-
12
-
13
-
14
-
15
-
16
-
17
-
18
-
19
-
20
-
21
-
22
-
23
-
24
-
25
-
26
-
27
-
28
-
29
-
30
-
31
-
32
-
33
-
34
-
35
-
36
-
37
-
38
-
39
-
40
-
41
-
42
-
43
-
44
-
45
-
46
-
47
-
48
-
49
-
50
-
51
-
52
-
53
-
54
-
55
-
56
-
57
-
58
-
59
-
60
-
61
-
62
-
63
-
64
-
65
-
66
-
67
-
68
-
69
-
70
-
71
-
72
-
73
-
74
-
75
-
76
-
77
-
78
-
79
-
80
-
 81
81 -
 82
82 -
 83
83 -
 84
84 -
 85
85 -
 86
86 -
 87
87 -
 88
88 -
 89
89 -
 90
90 -
 91
91 -
 92
92 -
 93
93 -
 94
94 -
 95
95 -
 96
96 -
 97
97 -
 98
98
 |
 |

WestJet Annual Report 2013 91
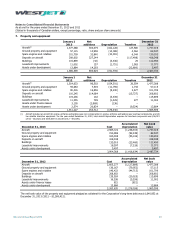
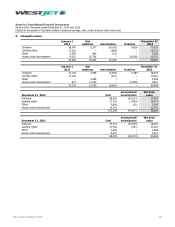
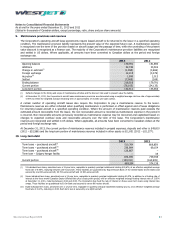
Notes to Consolidated Financial Statements
As at and for the years ended December 31, 2013 and 2012
(Stated in thousands of Canadian dollars, except percentage, ratio, share and per share amounts)
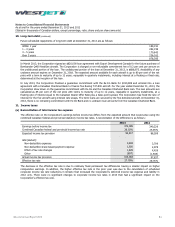
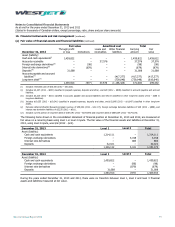
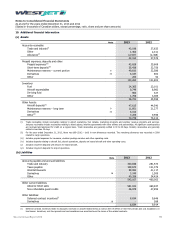
16. Financial instruments and risk management (continued)
(a) Fair value of financial assets and financial liabilities (continued)
Fair value Amortized cost Total
December 31, 2012
Through profit
or loss Derivatives
Loans and
receivables
Other financial
liabilities
Carrying
amount
Fair
value
Asset (liability):
Cash and cash equivalents(i) 1,459,822 – – – 1,459,822 1,459,822
Accounts receivable – – 37,576 – 37,576 37,576
Foreign exchange derivatives
(ii)
– (98) – – (98) (98)
Interest rate derivatives
(iii)
–(879)––(879)(879)
Deposits
(iv)
31,088 – – – 31,088 31,088
Accounts payable and accrued
liabilities(v) – – – (417,377) (417,377) (417,377)
Long-term debt
(vi)
– – – (739,048) (739,048) (810,640)
1,490,910 (977) 37,576 (1,156,425) 371,084 299,492
(i) Includes restricted cash of $58,106 (2012 – $51,623).
(ii) Includes $4,187 (2012 – $800) classified in prepaid expenses, deposits and other, and $29 (2012 – $898) classified in accounts payable and accrued
liabilities.
(iii) Includes $3,220 (2012 – $611) classifed in accounts payable and accrued liabilities and $4,103 classified in other long-term assets (2012 – $268 in
long-term liabilities).
(iv) Includes $19,355 (2012 – $19,241) classified in prepaid expenses, deposits and other, and $12,666 (2012 – $11,847) classified in other long-term
assets.
(v) Excludes deferred WestJet Rewards program revenue of $59,082 (2012 – $41,117), foreign exchange derivative liabilities of $29 (2012 – $898), and
interest rate derivative liabilities of $3,220 (2012 – $611).
(vi) Includes current portion of long-term debt of $189,191 (2012 – $164,909) and long-term debt of $689,204 (2012 – $574,139).
The following items shown in the consolidated statement of financial position at December 31, 2013 and 2012, are measured at
fair value on a recurring basis using level 1 or level 2 inputs. The fair value of the financial assets and liabilities at December 31,
2013, using level 3 inputs, was $nil (2012 $nil).
December 31, 2013
Level 1
Level 2
Total
Asset (liability):
Cash and cash equivalents 1,314,111 − 1,314,111
Foreign exchange derivatives − 4,158 4,158
Interest rate derivatives −883 883
Deposits 32,021 − 32,021
1,346,132 5,041 1,351,173
December 31, 2012
Level 1
Level 2
Total
Asset (liability):
Cash and cash equivalents 1,459,822 − 1,459,822
Foreign exchange derivatives − (98) (98)
Interest rate derivatives −(879) (879)
Deposits 31,088 − 31,088
1,490,910 (977) 1,489,933
During the years ended December 31, 2013 and 2012, there were no transfers between level 1, level 2 and level 3 financial
assets and liabilities measured at fair value.
85 9 6
7 0 3)
4 1 73
46 0 6
22 0 2
5 5)
3 1 12
5 0 5
0 6 84
s
47 4 7)
2 8 )
60 1 )
47 4 7)
2) 6) 6)
0) 1) 9)
5) 7 )
2 8 )
) 3 )