Westjet 2013 Annual Report Download - page 29
Download and view the complete annual report
Please find page 29 of the 2013 Westjet annual report below. You can navigate through the pages in the report by either clicking on the pages listed below, or by using the keyword search tool below to find specific information within the annual report.-
 1
1 -
2
-
3
-
4
-
5
-
6
-
7
-
8
-
9
-
10
-
11
-
12
-
13
-
14
-
15
-
16
-
17
-
18
-
 19
19 -
 20
20 -
 21
21 -
 22
22 -
 23
23 -
 24
24 -
 25
25 -
 26
26 -
 27
27 -
 28
28 -
 29
29 -
 30
30 -
 31
31 -
 32
32 -
 33
33 -
 34
34 -
 35
35 -
 36
36 -
 37
37 -
 38
38 -
 39
39 -
40
-
41
-
42
-
43
-
44
-
45
-
46
-
47
-
48
-
49
-
50
-
51
-
52
-
53
-
54
-
55
-
56
-
57
-
58
-
59
-
60
-
61
-
62
-
63
-
64
-
65
-
66
-
67
-
68
-
69
-
70
-
71
-
72
-
73
-
74
-
75
-
76
-
77
-
78
-
79
-
80
-
81
-
82
-
83
-
84
-
85
-
86
-
87
-
88
-
89
-
90
-
91
-
92
-
93
-
94
-
95
-
96
-
97
-
98
 |
 |

WestJet Annual Report 2013 29
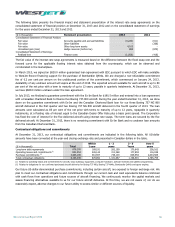
Foreign exchange
The gain or loss on foreign exchange included in our consolidated statement of earnings is mainly attributable to the effect of
the changes in the value of our US-dollar-denominated net monetary liabilities. At December 31, 2013, US-dollar-denominated
net monetary liabilities totaled approximately US $0.3 million (2012 – US $11.5 million). These net monetary liabilities consist
mainly of monetary assets of US-dollar cash and cash equivalents, security deposits on various leased aircraft, and
maintenance reserves paid to lessors, offset by monetary liabilities of US-dollar accounts payable and accrued liabilities and
maintenance provisions. We reported a foreign exchange gain of $1.1 million in 2013 and 2012 on the revaluation of our US-
dollar-denominated net monetary liabilities.
We periodically use financial derivatives to manage our exposure to foreign exchange risk. At December 31, 2013, to fix the
exchange rate on a portion of our US-dollar denominated aircraft lease payments, we entered into foreign exchange forward
contracts for an average of US $13.4 million per month for the period of January to December 2014 for a total of US $161.3
million at a weighted average contract price of 1.0425 Canadian dollars to one US dollar. Upon proper qualification, we
designated the forward contracts as effective cash flow hedges for accounting purposes. Under cash flow hedge accounting,
the effective portion of the change in the fair value of the hedging instrument is recognized in hedge reserves. Upon maturity
of the derivative instrument, the effective gains and losses previously recognized in hedge reserves are recorded in net
earnings as a component of aircraft leasing expense. At December 31, 2013, no portion of the forward contracts was
considered ineffective.
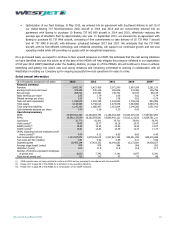
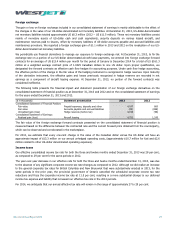
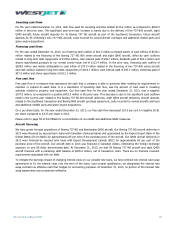
The following table presents the financial impact and statement presentation of our foreign exchange derivatives on the
consolidated statement of financial position as at December 31, 2013 and 2012 and on the consolidated statement of earnings
for the years ended December 31, 2013 and 2012.
($ in thousands)
Statement presentation
2013
2012
Consolidated Statement of Financial Position:
Fair value
Prepaid expenses, deposits and other
4,187
800
Fair value Accounts payable and accrued liabilities (29) (898)
Unrealized gain (loss) Hedge reserves (before tax) 4,158 (98)
Consolidated Statement of Earnings:
Realized gain (loss) Aircraft leasing 4,752 1,245
The fair value of the foreign exchange forward contracts presented on the consolidated statement of financial position is
measured based on the difference between the contracted rate and the current forward price obtained from the counterparty,
which can be observed and corroborated in the marketplace.
For 2014, we estimate that every one-cent change in the value of the Canadian dollar versus the US dollar will have an
approximate impact of $13.3 million on our annual unhedged operating costs, (approximately $10.7 million for fuel and $2.6
million related to other US-dollar denominated operating expenses).
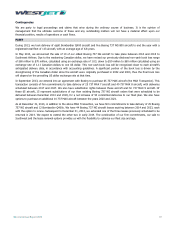
Income taxes
Our effective consolidated income tax rate for both the three and twelve months ended December 31, 2013 was 28 per cent,
as compared to 29 per cent for the same periods in 2012.
The year-over-year decrease in our effective rate for both the three and twelve months ended December 31, 2013, was due
to the absence of any significant corporate income tax rate changes as compared to 2012. Although we did realize an increase
to the general corporate tax rates for British Columbia and New Brunswick that were substantively enacted in 2013, for the
same periods in the prior year, the provincial government of Ontario cancelled the scheduled corporate income tax rate
reductions and froze the corporate income tax rate at 11.5 per cent, resulting in a more substantial change to our deferred
income tax expense and liability that increased our effective tax rate in the 2012 periods.
For 2014, we anticipate that our annual effective tax rate will remain in the range of approximately 27 to 29 per cent.