Westjet 2013 Annual Report Download - page 34
Download and view the complete annual report
Please find page 34 of the 2013 Westjet annual report below. You can navigate through the pages in the report by either clicking on the pages listed below, or by using the keyword search tool below to find specific information within the annual report.-
 1
1 -
2
-
3
-
4
-
5
-
6
-
7
-
8
-
9
-
10
-
11
-
12
-
13
-
14
-
15
-
16
-
17
-
18
-
19
-
20
-
21
-
22
-
23
-
 24
24 -
 25
25 -
 26
26 -
 27
27 -
 28
28 -
 29
29 -
 30
30 -
 31
31 -
 32
32 -
 33
33 -
 34
34 -
 35
35 -
 36
36 -
 37
37 -
 38
38 -
 39
39 -
 40
40 -
 41
41 -
 42
42 -
 43
43 -
 44
44 -
45
-
46
-
47
-
48
-
49
-
50
-
51
-
52
-
53
-
54
-
55
-
56
-
57
-
58
-
59
-
60
-
61
-
62
-
63
-
64
-
65
-
66
-
67
-
68
-
69
-
70
-
71
-
72
-
73
-
74
-
75
-
76
-
77
-
78
-
79
-
80
-
81
-
82
-
83
-
84
-
85
-
86
-
87
-
88
-
89
-
90
-
91
-
92
-
93
-
94
-
95
-
96
-
97
-
98
 |
 |

WestJet Annual Report 2013 34
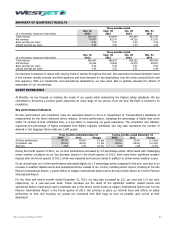
Despite these challenges, our year-over-year completion rate remained strong for both the three and twelve months ended
December 31, 2013, which highlights our ability to complete our originally scheduled flights and ensure our guests reach their
final destinations as soon as possible.
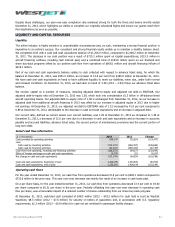
LIQUIDITY AND CAPITAL RESOURCES
Liquidity
The airline industry is highly sensitive to unpredictable circumstances and, as such, maintaining a strong financial position is
imperative to an airline’s success. Our consistent and strong financial results enable us to maintain a healthy balance sheet.
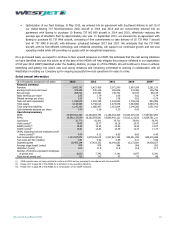
We completed 2013 with a cash and cash equivalents balance of $1,256.0 million, compared to $1,408.2 million at December
31, 2012. The decrease in our cash position was a result of $715.2 million spent on capital expenditures, $215.3 million in
aircraft financing outflows, including cash interest paid, and a combined total of $164.6 million spent on our dividend and
share buy-back programs offset by our positive cash flow from operations of $608.1 million and aircraft financing inflows of
$318.1 million.
Part of our cash and cash equivalents balance relates to cash collected with respect to advance ticket sales, for which the
balance at December 31, 2013, was $551.0 million, an increase of 14.6 per cent from $480.9 million at December 31, 2012.
We have cash and cash equivalents on hand to have sufficient liquidity to meet our liabilities, when due, under both normal
and stressed conditions. At December 31, 2013, we had cash on hand of 2.28 (2012 – 2.93) times our advance ticket sales
balance.
We monitor capital on a number of measures, including adjusted debt-to-equity and adjusted net debt to EBITDAR. Our
adjusted debt-to-equity ratio at December 31, 2013 was 1.38, which took into consideration $1.3 billion in off-balance-sheet
aircraft operating leases. Our adjusted debt-to-equity ratio of 1.38 is unchanged from December 31, 2012, as our increase in
adjusted debt from additional aircraft financing in 2013 was offset by our increase in adjusted equity in 2013 due to higher
net earnings. At December 31, 2013, our adjusted net debt to EBITDAR ratio of 1.22 increased by 41.9 per cent compared to
0.86 at December 31, 2012, attributable to the decrease in cash and cash equivalents and an increase in adjusted debt.
Our current ratio, defined as current assets over current liabilities, was 1.09 at December 31, 2013 as compared to 1.38 at
December 31, 2012, a decrease of 21.0 per cent due to a decrease in cash and cash equivalents and an increase in accounts
payable and accrued liabilities, advance ticket sales, the current portion of maintenance provisions and the current portion of
long-term debt.
Select cash flow information
($ in thousands) 2013 2012 Change
Cash provided by operating activities 608,147 722,624 (114,477)
Less:
Cash used by investing activities
(715,172)
(269,307)
(445,865)
Cash used by financing activities (61,547) (289,044) 227,497
Cash flow from operating, investing and financing activities
(168,572)
164,273
(332,845)
Effect of foreign exchange on cash and cash equivalents 16,378 321 16,057
Net change in cash and cash equivalents (152,194) 164,594 (316,788)
Cash and cash equivalents, beginning of year
1,408,199
1,243,605
164,594
Cash and cash equivalents, end of year 1,256,005 1,408,199 (152,194)
Operating cash flows
For the year ended December 31, 2013, our cash flow from operations decreased 15.8 per cent to $608.1 million compared to
$722.6 million in the prior year. This year-over-year decrease was mainly the result of an increase in cash taxes paid.
On a per share basis, for the year ended December 31, 2013, our cash flow from operations decreased 13.4 per cent to $4.60
per share compared to $5.31 per share in the prior year. Partially offsetting this year-over-year decrease in operating cash
flow per share, was a favourable impact of a reduced number of shares outstanding from our share buy-back program.
At December 31, 2013, restricted cash consisted of $48.5 million (2012 – $43.2 million) for cash held in trust by WestJet
Vacations; $8.3 million (2012 – $7.6 million) for security on letters of guarantee; and, in accordance with U.S. regulatory
requirements, $1.3 million (2012 – $0.9 million) for cash not yet remitted for passenger facility charges.