Westjet 2013 Annual Report Download - page 7
Download and view the complete annual report
Please find page 7 of the 2013 Westjet annual report below. You can navigate through the pages in the report by either clicking on the pages listed below, or by using the keyword search tool below to find specific information within the annual report.-
 1
1 -
 2
2 -
 3
3 -
 4
4 -
 5
5 -
 6
6 -
 7
7 -
 8
8 -
 9
9 -
 10
10 -
 11
11 -
 12
12 -
 13
13 -
 14
14 -
 15
15 -
 16
16 -
 17
17 -
 18
18 -
19
-
20
-
21
-
22
-
23
-
24
-
25
-
26
-
27
-
28
-
29
-
30
-
31
-
32
-
33
-
34
-
35
-
36
-
37
-
38
-
39
-
40
-
41
-
42
-
43
-
44
-
45
-
46
-
47
-
48
-
49
-
50
-
51
-
52
-
53
-
54
-
55
-
56
-
57
-
58
-
59
-
60
-
61
-
62
-
63
-
64
-
65
-
66
-
67
-
68
-
69
-
70
-
71
-
72
-
73
-
74
-
75
-
76
-
77
-
78
-
79
-
80
-
81
-
82
-
83
-
84
-
85
-
86
-
87
-
88
-
89
-
90
-
91
-
92
-
93
-
94
-
95
-
96
-
97
-
98
 |
 |

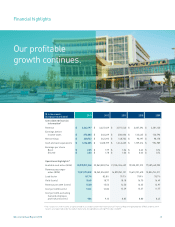
WestJet Annual Report 2013 7
17,588
19,535
21,186 22,064
23,971
Available seat miles
(millions)
2009 2010 2011 2012 2013
14,039
15,174 16,041
17,423
18,485
2,281
2,607
3,072
3,427
3,662
Revenue*
(millions of dollars)
Segment guests
(thousands)
2009 2010 2011 2012 2013 2009 2010 2011 2012 2013
WestJet’s positive
revenue and
earnings momentum
continued in 2013.
* The results for 2010 to 2013 are presented in accordance with the International Financial Reporting Standards (IFRS) and the 2009
results are reported under Canadian Generally Accepted Accounting Principles (GAAP).
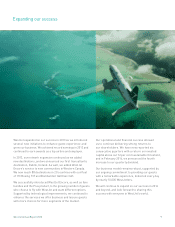
Expanding our success
Our profitable
growth continues.