Westjet 2013 Annual Report Download - page 33
Download and view the complete annual report
Please find page 33 of the 2013 Westjet annual report below. You can navigate through the pages in the report by either clicking on the pages listed below, or by using the keyword search tool below to find specific information within the annual report.-
 1
1 -
2
-
3
-
4
-
5
-
6
-
7
-
8
-
9
-
10
-
11
-
12
-
13
-
14
-
15
-
16
-
17
-
18
-
19
-
20
-
21
-
22
-
 23
23 -
 24
24 -
 25
25 -
 26
26 -
 27
27 -
 28
28 -
 29
29 -
 30
30 -
 31
31 -
 32
32 -
 33
33 -
 34
34 -
 35
35 -
 36
36 -
 37
37 -
 38
38 -
 39
39 -
 40
40 -
 41
41 -
 42
42 -
 43
43 -
44
-
45
-
46
-
47
-
48
-
49
-
50
-
51
-
52
-
53
-
54
-
55
-
56
-
57
-
58
-
59
-
60
-
61
-
62
-
63
-
64
-
65
-
66
-
67
-
68
-
69
-
70
-
71
-
72
-
73
-
74
-
75
-
76
-
77
-
78
-
79
-
80
-
81
-
82
-
83
-
84
-
85
-
86
-
87
-
88
-
89
-
90
-
91
-
92
-
93
-
94
-
95
-
96
-
97
-
98
 |
 |

WestJet Annual Report 2013 33
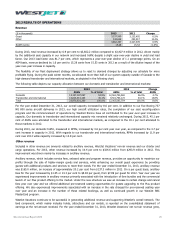
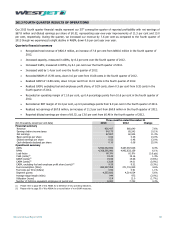
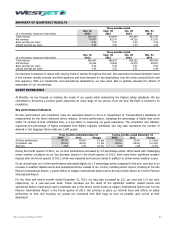
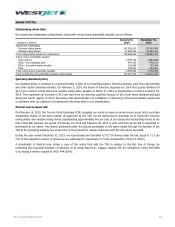
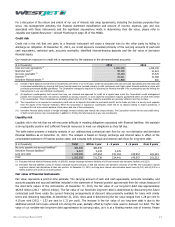
SUMMARY OF QUARTERLY RESULTS
Three months ended
($ in thousands, except per share data)
Dec. 31
2013
Sept. 30
2013
Jun. 30
2013
Mar. 31
2013
Total revenue 926,417 924,844 843,694 967,242
Net earnings 67,807 65,107 44,735 91,073
Basic earnings per share
0.52
0.50
0.34
0.69
Diluted earnings per share 0.52 0.50 0.34 0.68
Three months ended
($ in thousands, except per share data)
Dec. 31
2012
Sept. 30
2012
Jun. 30
2012
Mar. 31
2012
Total revenue 860,640 866,537 809,282 890,950
Net earnings
60,944
70,648
42,479
68,321
Basic earnings per share 0.46 0.53 0.31 0.50
Diluted earnings per share 0.46 0.52 0.31 0.49
Our business is seasonal in nature with varying levels of activity throughout the year. We experience increased domestic travel
in the summer months (second and third quarters) and more demand for sun destinations over the winter period (fourth and
first quarters). With our transborder and international destinations, we have been able to partially alleviate the effects of
seasonality on our net earnings.
GUEST EXPERIENCE
At WestJet, we are focused on meeting the needs of our guests while maintaining the highest safety standards. We are
committed to delivering a positive guest experience at every stage of our service, from the time the flight is booked to its
completion.
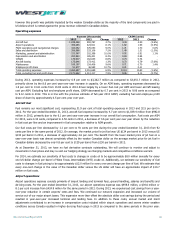
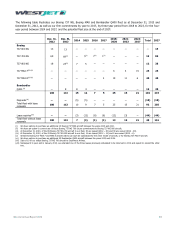
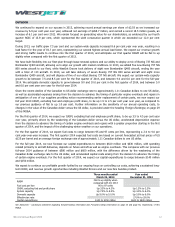
Key performance indicators
On-time performance and completion rates are calculated based on the U.S. Department of Transportation’s standards of
measurement for the North American airline industry. On-time performance, indicating the percentage of flights that arrive
within 15 minutes of their scheduled time, is a key factor in measuring our guest experience. The completion rate indicator
represents the percentage of flights completed from flights originally scheduled. Our bag ratio represents the number of
delayed or lost baggage claims made per 1,000 guests.
Three months ended December 31
Twelve months ended December 31
2013
2012
Change
2013
2012
Change
On-time performance
69.3%
64.0%
5.3 pts
73.9%
75.4%
(1.5 pts)
Completion rate 98.6% 98.5% 0.1 pts 98.6% 98.9% (0.3 pts)
Bag ratio 3.62 2.94 23.1% 3.25 2.68 21.3%
During the fourth quarter of 2013, our on-time performance increased by 5.3 percentage points. While faced with challenging
winter weather conditions at our key domestic airports in the fourth quarter of 2013, there were fewer significant weather
impacts than the fourth quarter of 2012, which was impacted by Hurricane Sandy in addition to similar winter weather issues.
On an annual basis our on-time performance decreased slightly by 1.5 percentage points compared to the prior year due to an
increase in weather-related events and operational factors outside of our control, including winter storms, flooding at Toronto
Pearson International Airport, a power failure at Calgary International Airport and a de-icing facility failure at Toronto Pearson
International Airport.
For the three and twelve months ended December 31, 2013, our bag ratio increased by 23.1 per cent and 21.3 per cent,
respectively, on a year-over-year basis. These increases are the result of the significant weather related events and
operational factors noted above and in particular due to the severe winter events at Calgary International Airport and Toronto
Pearson International Airport in the fourth quarter of 2013. We continue to place our internal focus and efforts on safely
performing on time and ensuring our guests are connected with their bags as soon as possible upon arrival at their
destination.