Westjet 2013 Annual Report Download - page 24
Download and view the complete annual report
Please find page 24 of the 2013 Westjet annual report below. You can navigate through the pages in the report by either clicking on the pages listed below, or by using the keyword search tool below to find specific information within the annual report.-
 1
1 -
2
-
3
-
4
-
5
-
6
-
7
-
8
-
9
-
10
-
11
-
12
-
13
-
 14
14 -
 15
15 -
 16
16 -
 17
17 -
 18
18 -
 19
19 -
 20
20 -
 21
21 -
 22
22 -
 23
23 -
 24
24 -
 25
25 -
 26
26 -
 27
27 -
 28
28 -
 29
29 -
 30
30 -
 31
31 -
 32
32 -
 33
33 -
 34
34 -
35
-
36
-
37
-
38
-
39
-
40
-
41
-
42
-
43
-
44
-
45
-
46
-
47
-
48
-
49
-
50
-
51
-
52
-
53
-
54
-
55
-
56
-
57
-
58
-
59
-
60
-
61
-
62
-
63
-
64
-
65
-
66
-
67
-
68
-
69
-
70
-
71
-
72
-
73
-
74
-
75
-
76
-
77
-
78
-
79
-
80
-
81
-
82
-
83
-
84
-
85
-
86
-
87
-
88
-
89
-
90
-
91
-
92
-
93
-
94
-
95
-
96
-
97
-
98
 |
 |

WestJet Annual Report 2013 24
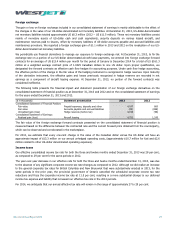
Optimization of our fleet strategy. In May 2013, we entered into an agreement with Southwest Airlines to sell 10 of
our oldest Boeing 737 Next-Generation (NG) aircraft in 2014 and 2015 and we concurrently entered into an
agreement with Boeing to purchase 10 Boeing 737 NG 800 aircraft in 2014 and 2015, effectively reducing the
average age of WestJet’s fleet by approximately one year. In September 2013, we entered into an agreement with
Boeing to purchase 65 737 MAX aircraft, consisting of firm commitments to take delivery of 25 737 MAX 7 aircraft
and 40 737 MAX 8 aircraft, with deliveries scheduled between 2017 and 2027. We anticipate that the 737 MAX
aircraft, with its fuel-efficient technology and enhanced amenities, will support our continued growth and low-cost
operating model while still providing our guests with an exceptional experience.
On a go-forward basis, we expect to continue to face upward pressures on CASM. We anticipate that the cost saving initiatives
we have identified and put into action as of the date of this MD&A will help mitigate this pressure reflected in our expectation
of full year 2014 CASM (described under the heading
Outlook
, on page 41 of this MD&A). We will continue to focus on actively
identifying and putting into action new cost saving initiatives and remaining committed to working in collaboration with all
WestJetters in setting our Company up for ongoing successful low-cost operations for years to come.
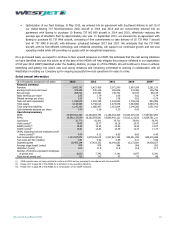
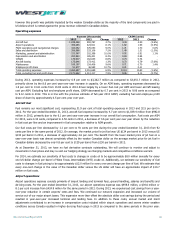
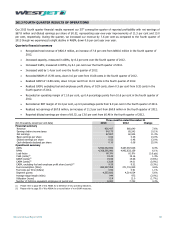
Select annual information
($ in thousands, except per unit data)
2013
2012
2011
2010
2009(i)
Financial summary
Revenue 3,662,197 3,427,409 3,071,540 2,607,294 2,281,120
Earnings before income taxes
372,085
340,229
208,006
133,465
136,796
Net earnings 268,722 242,392 148,702 90,197 98,178
Basic earnings per share 2.05 1.79 1.06 0.62 0.74
Diluted earnings per share
2.03
1.78
1.06
0.62
0.74
Cash and cash equivalents 1,256,005 1,408,199 1,243,605 1,159,316 994,989
Total assets 4,143,463 3,746,615 3,473,678 3,383,980 3,493,702
Total long-term liabilities
1,147,163
1,086,457
1,161,604
1,240,285
1,051,912
Cash dividends declared per share 0.40 0.28 0.20 0.05 ―
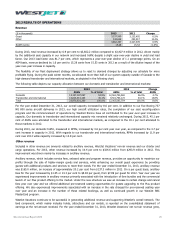
Operational summary
ASMs
23,970,921,260
22,063,583,754
21,186,304,409
19,535,291,313
17,587,640,902
RPMs 19,591,173,039 18,262,554,881 16,890,941,121 15,613,121,610 13,834,761,211
Load factor 81.7% 82.8% 79.7% 79.9% 78.7%
Yield (cents)(ii)
18.69
18.77
18.18
16.70
16.49
RASM (cents)(ii) 15.28 15.53 14.50 13.35 12.97
CASM (cents)
(ii)
13.61 13.83 13.29 12.37 11.77
CASM, excluding fuel and employee profit
share (cents)(iii) 9.06 9.12 8.85 8.80 8.45
Fuel consumption (litres) 1,144,937,872 1,079,108,614 1,027,821,192 950,341,292 859,115,698
Fuel costs per litre (dollars)
0.91
0.92
0.89
0.71
0.66
Segment guests 18,485,144 17,423,352 16,040,682 15,173,581 14,038,827
Average stage length (miles) 976 978 984 968 923
Utilization (hours)
12.0
11.9
11.8
11.6
11.7
Number of full-time equivalent employees
at period end 8,000 7,742 7,141 6,877 6,291
Fleet size at period end
113
100
97
91
86
(i) 2009 amounts have not been restated to conform to IFRS and are presented in accordance with Previous GAAP.
(ii) Please refer to page 59 of this MD&A for a definition of key operating indicators.
(iii) Please refer to page 59 of this MD&A for a reconciliation of non-GAAP measures.