Westjet 2013 Annual Report Download - page 25
Download and view the complete annual report
Please find page 25 of the 2013 Westjet annual report below. You can navigate through the pages in the report by either clicking on the pages listed below, or by using the keyword search tool below to find specific information within the annual report.-
 1
1 -
2
-
3
-
4
-
5
-
6
-
7
-
8
-
9
-
10
-
11
-
12
-
13
-
14
-
 15
15 -
 16
16 -
 17
17 -
 18
18 -
 19
19 -
 20
20 -
 21
21 -
 22
22 -
 23
23 -
 24
24 -
 25
25 -
 26
26 -
 27
27 -
 28
28 -
 29
29 -
 30
30 -
 31
31 -
 32
32 -
 33
33 -
 34
34 -
 35
35 -
36
-
37
-
38
-
39
-
40
-
41
-
42
-
43
-
44
-
45
-
46
-
47
-
48
-
49
-
50
-
51
-
52
-
53
-
54
-
55
-
56
-
57
-
58
-
59
-
60
-
61
-
62
-
63
-
64
-
65
-
66
-
67
-
68
-
69
-
70
-
71
-
72
-
73
-
74
-
75
-
76
-
77
-
78
-
79
-
80
-
81
-
82
-
83
-
84
-
85
-
86
-
87
-
88
-
89
-
90
-
91
-
92
-
93
-
94
-
95
-
96
-
97
-
98
 |
 |

WestJet Annual Report 2013 25
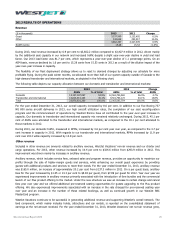
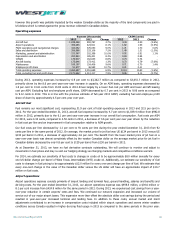
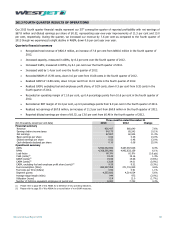
2013 RESULTS OF OPERATIONS
Revenue
($ in thousands) 2013 2012 Change
Guest
3,337,569
3,133,492
6.5%
Other 324,628 293,917 10.4%
3,662,197 3,427,409 6.9%
RASM (cents)
15.28
15.53
(1.6%)
During 2013, total revenue increased by 6.9 per cent to $3,662.2 million compared to $3,427.4 million in 2012, driven mainly
by the additional seat capacity in our network and increased traffic despite a slight year-over-year decline in yield and load
factor. Our 2013 load factor was 81.7 per cent, which represents a year-over-year decline of 1.1 percentage points. On an
ASM basis, revenue declined by 1.6 per cent to 15.28 cents from 15.53 cents in 2012 as a result of the dilutive impact of the
year-over-year increase in capacity.
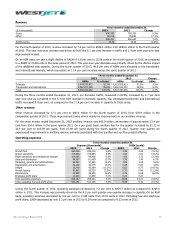
The flexibility of our fleet deployment strategy allows us to react to demand changes by adjusting our schedule for more
profitable flying. During the peak winter months, we allocated more than half of our system capacity outside of Canada to the
high-demand transborder and international markets, as depicted in the following chart.
The following table depicts our capacity allocation between our domestic and transborder and international markets:
2013
2012
Change
ASMs
% of total
ASMs
% of total
ASMs
Domestic 13,157,007,097 54.9% 12,561,790,582 56.9% 4.7%
Transborder and international
10,813,914,163
45.1%
9,501,793,172
43.1%
13.8%
Total
23,970,921,260
100.0%
22,063,583,754
100.0%
8.6%
For the year ended December 31, 2013, our overall capacity increased by 8.6 per cent.
In addition to our five Boeing 737
NG 800 series aircraft deliveries in 2013, our high aircraft utilization rates, the completion of our seat reconfiguration
program and the commencement of operations by WestJet Encore have all contributed to the year-over-year increase in
capacity. Our domestic to transborder and international capacity mix remained relatively unchanged. During 2013, 45.1 per
cent of ASMs were allocated to the transborder and international markets, as compared to the 43.1 per cent allocated to
those markets in 2012.
During 2013, our domestic traffic, measured in RPMs, increased by 3.6 per cent year over year, as compared to the 4.7 per
cent increase in capacity in 2012. With regards to our transborder and international markets, RPMs increased by 11.9 per
cent over 2012 while capacity increased by 13.8 per cent.
Other revenue
Included in other revenue are amounts related to ancillary revenue, WestJet Vacations’ non-air revenue and our charter and
cargo operations. For 2013, other revenue increased by 10.4 per cent to $324.6 million from $293.9 million in 2012. This
improvement was driven mainly by increases in ancillary revenue.
Ancillary revenue, which includes service fees, onboard sales and program revenue, provides an opportunity to maximize our
profits through the sale of higher-margin goods and services, while enhancing our overall guest experience by providing
guests with additional products and services to meet their needs. For the year ended December 31, 2013, ancillary revenue
was $165.0 million, an increase of approximately 20.2 per cent from $137.3 million in 2012. On a per guest basis, ancillary
fees for the year increased by $1.05 or 13.3 per cent to $8.94 per guest, from $7.89 per guest for 2012. Year over year we
experienced improvements in ancillary revenue primarily associated with the introduction of fare bundles and the commercial
launch of our Plus product offering to the market. Under the new structure we saw an increase to certain change and cancel
fees year over year and we offered additional pre-reserved seating opportunities for guests upgrading to the Plus product
offering. We also experienced improvements associated with an increase in the rate charged for pre-reserved seating year
over year and an increase in the number of these related bookings, as well as continued growth in our WestJet RBC
MasterCard program.
WestJet Vacations continues to be successful in generating additional revenue and supporting WestJet’s overall network. The
land component, which mainly includes hotels, attractions and car rentals, is reported on the consolidated statement of
earnings at the net amount received. For the year ended December 31, 2013, WestJet Vacations’ net non-air revenue grew,