Westjet 2013 Annual Report Download - page 60
Download and view the complete annual report
Please find page 60 of the 2013 Westjet annual report below. You can navigate through the pages in the report by either clicking on the pages listed below, or by using the keyword search tool below to find specific information within the annual report.-
 1
1 -
2
-
3
-
4
-
5
-
6
-
7
-
8
-
9
-
10
-
11
-
12
-
13
-
14
-
15
-
16
-
17
-
18
-
19
-
20
-
21
-
22
-
23
-
24
-
25
-
26
-
27
-
28
-
29
-
30
-
31
-
32
-
33
-
34
-
35
-
36
-
37
-
38
-
39
-
40
-
41
-
42
-
43
-
44
-
45
-
46
-
47
-
48
-
49
-
 50
50 -
 51
51 -
 52
52 -
 53
53 -
 54
54 -
 55
55 -
 56
56 -
 57
57 -
 58
58 -
 59
59 -
 60
60 -
 61
61 -
 62
62 -
 63
63 -
 64
64 -
 65
65 -
 66
66 -
 67
67 -
 68
68 -
 69
69 -
 70
70 -
71
-
72
-
73
-
74
-
75
-
76
-
77
-
78
-
79
-
80
-
81
-
82
-
83
-
84
-
85
-
86
-
87
-
88
-
89
-
90
-
91
-
92
-
93
-
94
-
95
-
96
-
97
-
98
 |
 |

WestJet Annual Report 2013 60
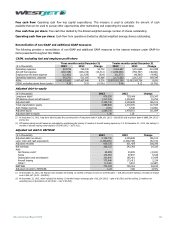
Free cash flow: Operating cash flow less capital expenditures. This measure is used to calculate the amount of cash
available that can be used to pursue other opportunities after maintaining and expanding the asset base.
Free cash flow per share: Free cash flow divided by the diluted weighted average number of shares outstanding.
Operating cash flow per share: Cash flow from operations divided by diluted weighted average shares outstanding.
Reconciliation of non-GAAP and additional GAAP measures
The following provides a reconciliation of non-GAAP and additional GAAP measures to the nearest measure under GAAP for
items presented throughout this MD&A.
CASM, excluding fuel and employee profit share
Three months ended December 31
Twelve months ended December 31
($ in thousands) 2013 2012 Change 2013 2012 Change
Operating expenses 824,742 769,040 55,702 3,262,687 3,051,689 210,998
Aircraft fuel expense (260,528) (246,216) (14,312) (1,039,448) (992,787) (46,661)
Employee profit share expense
(12,463)
(11,639)
(824)
(51,577)
(46,585)
(4,992)
Operating expenses, adjusted
551,751
511,185
40,566
2,171,662
2,012,317
159,345
ASMs 5,942,032,692 5,487,467,646 8.3% 23,970,921,260 22,063,583,754 8.6%
CASM, excluding above items (cents) 9.29 9.32 (0.3%) 9.06 9.12 (0.7%)
Adjusted debt-to-equity
($ in thousands)
2013
2012
Change
Long-term debt
(i)
878,395
739,048
139,347
Off-balance-sheet aircraft leases
(ii)
1,317,345
1,300,590
16,755
Adjusted debt
2,195,740
2,039,638
156,102
Total shareholders’ equity
1,589,840
1,472,305
117,535
Add: Hedge reserves
(105)
5,746
(5,851)
Adjusted equity
1,589,735
1,478,051
111,684
Adjusted debt-to-equity
1.38
1.38
–
(i) At December 31, 2013, long-term debt includes the current portion of long-term debt of $189,191 (2012 – $164,909) and long-term debt of $689,204 (2012 –
$574,139).
(ii) Off-balance-sheet aircraft leases are calculated by multiplying the trailing 12 months of aircraft leasing expense by 7.5. At December 31, 2013, the trailing 12
months of aircraft leasing costs totaled $175,646 (2012 – $173,412).
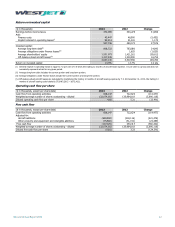
Adjusted net debt to EBITDAR
($ in thousands)
2013
2012
Change
Adjusted debt (as above) 2,195,740 2,039,638 156,102
Less: Cash and cash equivalents (1,256,005) (1,408,199) 152,194
Adjusted net debt 939,735 631,439 308,296
Net earnings 268,722 242,392 26,330
Add:
Net finance costs
(i)
25,599
30,509
(4,910)
Taxes 103,363 97,837 5,526
Depreciation and amortization 200,840 185,401 15,439
Aircraft leasing
175,646
173,412
2,234
Other(ii) (1,136) 5,451 (6,587)
EBITDAR 773,034 735,002 38,032
Adjusted net debt to EBITDAR
1.22
0.86
41.9%
(i) At December 31, 2013, net finance costs includes the trailing 12 months of finance income of $17,848 (2012 – $18,391) and the trailing 12 months of finance
cost of $43,447 (2012 – $48,900).
(ii) At December 31, 2013, other includes the trailing 12 months foreign exchange gain of $1,136 (2012 – gain of $1,061) and the trailing 12 months non-
operating loss on derivatives of $nil (2012 – loss of $6,512).