Westjet 2013 Annual Report Download - page 61
Download and view the complete annual report
Please find page 61 of the 2013 Westjet annual report below. You can navigate through the pages in the report by either clicking on the pages listed below, or by using the keyword search tool below to find specific information within the annual report.-
 1
1 -
2
-
3
-
4
-
5
-
6
-
7
-
8
-
9
-
10
-
11
-
12
-
13
-
14
-
15
-
16
-
17
-
18
-
19
-
20
-
21
-
22
-
23
-
24
-
25
-
26
-
27
-
28
-
29
-
30
-
31
-
32
-
33
-
34
-
35
-
36
-
37
-
38
-
39
-
40
-
41
-
42
-
43
-
44
-
45
-
46
-
47
-
48
-
49
-
50
-
 51
51 -
 52
52 -
 53
53 -
 54
54 -
 55
55 -
 56
56 -
 57
57 -
 58
58 -
 59
59 -
 60
60 -
 61
61 -
 62
62 -
 63
63 -
 64
64 -
 65
65 -
 66
66 -
 67
67 -
 68
68 -
 69
69 -
 70
70 -
 71
71 -
72
-
73
-
74
-
75
-
76
-
77
-
78
-
79
-
80
-
81
-
82
-
83
-
84
-
85
-
86
-
87
-
88
-
89
-
90
-
91
-
92
-
93
-
94
-
95
-
96
-
97
-
98
 |
 |

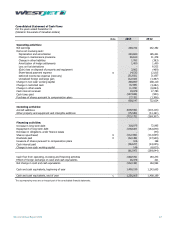
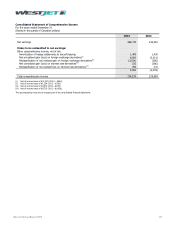
WestJet Annual Report 2013 61
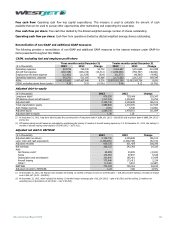
Return on invested capital
($ in thousands)
2013
2012
Change
Earnings before income taxes 372,085 340,229 31,856
Add:
Finance costs 43,447 48,900 (5,453)
Implicit interest in operating leases
(i)
92,214 91,041 1,173
507,746 480,170 27,576
Invested capital:
Average long-term debt
(ii)
808,722 783,880 24,842
Average obligations under finance leases(iii)
1,625
(1,625)
Average shareholders' equity 1,531,073 1,421,261 109,812
Off-balance-sheet aircraft leases
(iv)
1,317,345 1,300,590 16,755
3,657,140 3,507,356 149,784
Return on invested capital 13.9% 13.7% 0.2 pts
(i) Interest implicit in operating leases is equal to 7.0 per cent of 7.5 times the trailing 12 months of aircraft lease expense. 7.0 per cent is a proxy and does not
necessarily represent actual for any given period.
(ii) Average long-term debt includes the current portion and long-term portion.
(iii) Average obligations under finance leases include the current portion and long-term portion.
(iv) Off-balance-sheet aircraft leases are calculated by multiplying the trailing 12 months of aircraft leasing expense by 7.5. At December 31, 2013, the trailing 12
months of aircraft leasing costs totaled $175,646 (2012 – $173,412).
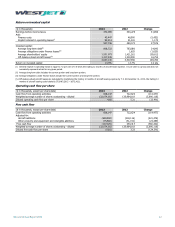
Operating cash flow per share
($ in thousands, except per share data)
2013
2012
Change
Cash flow from operating activities
608,147
722,624
(114,477)
Weighted average number of shares outstanding - diluted 132,074,002 135,964,118 (3,890,116)
Diluted operating cash flow per share
4.60
5.31
(13.4%)
Free cash flow
($ in thousands, except per share data) 2013 2012 Change
Cash flow from operating activities 608,147 722,624 (114,477)
Adjusted for:
Aircraft additions
(639,592)
(218,116)
(421,476)
Other property and equipment and intangible additions (75,580) (51,191) (24,389)
Free cash flow (107,025) 453,317 (560,342)
Weighted average number of shares outstanding - diluted
132,074,002
135,964,118
(3,890,116)
Diluted free cash flow per share
(0.81)
3.33
(124.3%)