Westjet 2013 Annual Report Download - page 79
Download and view the complete annual report
Please find page 79 of the 2013 Westjet annual report below. You can navigate through the pages in the report by either clicking on the pages listed below, or by using the keyword search tool below to find specific information within the annual report.-
 1
1 -
2
-
3
-
4
-
5
-
6
-
7
-
8
-
9
-
10
-
11
-
12
-
13
-
14
-
15
-
16
-
17
-
18
-
19
-
20
-
21
-
22
-
23
-
24
-
25
-
26
-
27
-
28
-
29
-
30
-
31
-
32
-
33
-
34
-
35
-
36
-
37
-
38
-
39
-
40
-
41
-
42
-
43
-
44
-
45
-
46
-
47
-
48
-
49
-
50
-
51
-
52
-
53
-
54
-
55
-
56
-
57
-
58
-
59
-
60
-
61
-
62
-
63
-
64
-
65
-
66
-
67
-
68
-
 69
69 -
 70
70 -
 71
71 -
 72
72 -
 73
73 -
 74
74 -
 75
75 -
 76
76 -
 77
77 -
 78
78 -
 79
79 -
 80
80 -
 81
81 -
 82
82 -
 83
83 -
 84
84 -
 85
85 -
 86
86 -
 87
87 -
 88
88 -
 89
89 -
90
-
91
-
92
-
93
-
94
-
95
-
96
-
97
-
98
 |
 |

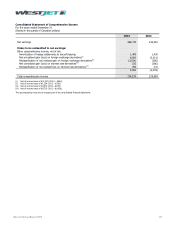
WestJet Annual Report 2013 79
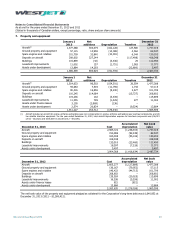
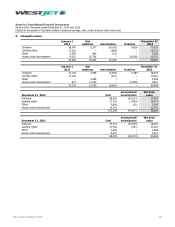
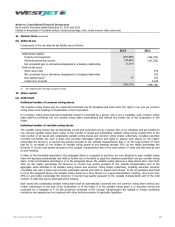
Notes to Consolidated Financial Statements
As at and for the years ended December 31, 2013 and 2012
(Stated in thousands of Canadian dollars, except percentage, ratio, share and per share amounts)
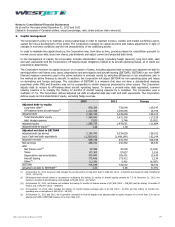
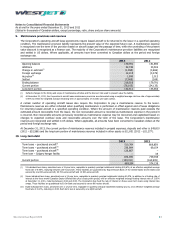
3. Capital management
The Corporation’s policy is to maintain a strong capital base in order to maintain investor, creditor and market confidence and to
sustain the future development of the airline. The Corporation manages its capital structure and makes adjustments in light of
changes in economic conditions and the risk characteristics of the underlying assets.
In order to maintain the capital structure, the Corporation may, from time to time, purchase shares for cancellation pursuant to
normal course issuer bids, issue new shares, pay dividends and adjust current and projected debt levels.
In the management of capital, the Corporation includes shareholders’ equity (excluding hedge reserves), long-term debt, cash
and cash equivalents and the Corporation’s off-balance-sheet obligations related to its aircraft operating leases, all of which are
presented in detail below.
The Corporation monitors its capital structure on a number of bases, including adjusted debt-to-equity and adjusted net debt to
earnings before net finance cost, taxes, depreciation and amortization and aircraft leasing (EBITDAR). EBITDAR is an non-GAAP
financial measure commonly used in the airline industry to evaluate results by excluding differences in tax jurisdictions and in
the method an airline finances its aircraft. In addition, the Corporation will adjust EBITDAR for non-operating gains and losses
on derivatives and foreign exchange. The calculation of EBITDAR is a measure that does not have a standardized meaning
prescribed under IFRS and therefore may not be comparable to similar measures presented by other issuers. The Corporation
adjusts debt to include its off-balance-sheet aircraft operating leases. To derive a present-value debt equivalent, common
industry practice is to multiply the trailing 12 months of aircraft leasing expense by a multiplier. The Corporation uses a
multiplier of 7.5. The Corporation defines adjusted net debt as adjusted debt less cash and cash equivalents. The Corporation
defines equity as total shareholders’ equity, excluding hedge reserves.
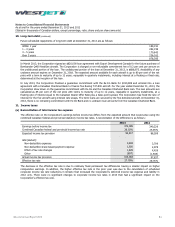
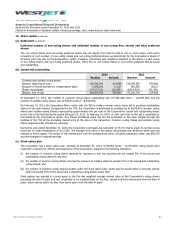
2013 2012 Change
Adjusted debt-to-equity
Long-term debt
(i)
878,395 739,048 139,347
Off-balance-sheet aircraft leases
(ii)
1,317,345 1,300,590 16,755
Adjusted debt 2,195,740 2,039,638 156,102
Total shareholders’ equity 1,589,840 1,472,305 117,535
Add: Hedge reserves (105) 5,746 (5,851)
Adjusted equity 1,589,735 1,478,051 111,684
Adjusted debt-to-equity
(v)
1.38 1.38 –
Adjusted net debt to EBITDAR
Adjusted debt (as above) 2,195,740 2,039,638 156,102
Less: Cash and cash equivalents (1,256,005) (1,408,199) 152,194
Adjusted net debt 939,735 631,439 308,296
Net earnings 268,722 242,392 26,330
Add:
Net finance cost
(iii)
25,599 30,509 (4,910)
Taxes 103,363 97,837 5,526
Depreciation and amortization 200,840 185,401 15,439
Aircraft leasing 175,646 173,412 2,234
Other(iv) (1,136) 5,451 (6,587)
EBITDAR 773,034 735,002 38,032
Adjusted net debt to EBITDAR
(v)
1.22 0.86 41.9%
(i) At December 31, 2013, long-term debt includes the current portion of long-term debt of $189,191 (2012 – $164,909) and long-term debt of $689,204
(2012 – $574,139).
(ii) Off-balance-sheet aircraft leases is calculated by multiplying the trailing 12 months of aircraft leasing expense by 7.5. At December 31, 2013, the
trailing 12 months of aircraft leasing costs totaled $175,646 (2012 – $173,412).
(iii) At December 31, 2013, net finance cost includes the trailing 12 months of finance income of $17,848 (2012 – $18,391) and the trailing 12 months of
finance cost of $43,447 (2012 – $48,900).
(iv) At December 31, 2013, other includes the trailing 12 months foreign exchange gain of $1,136 (2012 – $1,061) and the trailing 12 months non-
operating loss on derivatives of $nil (2012 – $1).
(v) At December 31, 2013 and 2012, the Corporation exceeded its internal targets of an adjusted debt-to-equity measure of no more than 3.00 and an
adjusted net debt to EBITDAR measure of no more than 3.00.
85 9 6
7 0 3)
4 1 73
46 0 6
22 0 2
5 5)
3 1 12
5 0 5
0 6 84
s
47 4 7)
2 8 )
60 1 )
47 4 7)
2) 6) 6)
0) 1) 9)
5) 7 )
2 8 )
) 3 )