Westjet 2013 Annual Report Download - page 31
Download and view the complete annual report
Please find page 31 of the 2013 Westjet annual report below. You can navigate through the pages in the report by either clicking on the pages listed below, or by using the keyword search tool below to find specific information within the annual report.-
 1
1 -
2
-
3
-
4
-
5
-
6
-
7
-
8
-
9
-
10
-
11
-
12
-
13
-
14
-
15
-
16
-
17
-
18
-
19
-
20
-
 21
21 -
 22
22 -
 23
23 -
 24
24 -
 25
25 -
 26
26 -
 27
27 -
 28
28 -
 29
29 -
 30
30 -
 31
31 -
 32
32 -
 33
33 -
 34
34 -
 35
35 -
 36
36 -
 37
37 -
 38
38 -
 39
39 -
 40
40 -
 41
41 -
42
-
43
-
44
-
45
-
46
-
47
-
48
-
49
-
50
-
51
-
52
-
53
-
54
-
55
-
56
-
57
-
58
-
59
-
60
-
61
-
62
-
63
-
64
-
65
-
66
-
67
-
68
-
69
-
70
-
71
-
72
-
73
-
74
-
75
-
76
-
77
-
78
-
79
-
80
-
81
-
82
-
83
-
84
-
85
-
86
-
87
-
88
-
89
-
90
-
91
-
92
-
93
-
94
-
95
-
96
-
97
-
98
 |
 |

WestJet Annual Report 2013 31
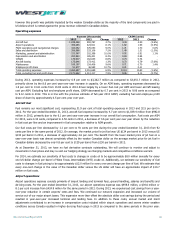
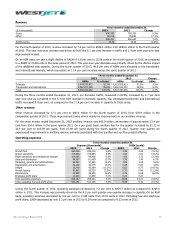
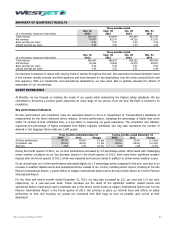
Revenue
Three months ended December 31
($ in thousands) 2013 2012 Change
Guest 836,399 783,750 6.7%
Other 90,018 76,890 17.1%
926,417 860,640 7.6%
RASM (cents) 15.59 15.68 (0.6%)
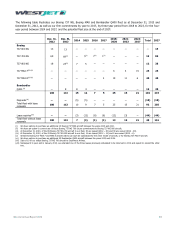
For the fourth quarter of 2013, revenue increased by 7.6 per cent to $926.4 million from $860.6 million in the fourth quarter
of 2012. This year-over-year increase was driven by both the 6.1 per cent increase in traffic and 1.4 per cent year-over-year
improvement in yield.
On an ASM basis, we saw a slight decline in RASM of 0.6 per cent to 15.59 cents in the fourth quarter of 2013, as compared
to a RASM of 15.68 cents in the same period of 2012. This year-over-year decrease was primarily driven by the dilutive impact
of the additional seat capacity. During the fourth quarter of 2013, 49.9 per cent of ASMs were allocated to the transborder
and international markets, which represents an 11.4 per cent increase versus the same quarter of 2012.
Three months ended December 31
2013
2012
Change
ASMs % of total ASMs % of total ASMs
Domestic 2,974,310,927 50.1% 2,823,935,413 51.5% 5.3%
Transborder and international 2,967,721,765 49.9% 2,663,532,233 48.5% 11.4%
Total 5,942,032,692 100.0% 5,487,467,646 100.0% 8.3%
During the three months ended December 31, 2013, our domestic traffic, measured in RPMs, increased by 2.7 per cent
year-over-year as compared to the 5.3 per cent increase in domestic capacity. Our scheduled transborder and international
traffic increased 9.8 per cent, as compared to the 11.4 per cent increase in capacity to these areas.
Other revenue
Other revenue increased by 17.1 per cent to $90.0 million for the fourth quarter of 2013, from $76.9 million in the
comparable quarter of 2012. These improvements were driven mainly by improvements in our ancillary revenue.
For the three months ended December 31, 2013 ancillary revenue was $45.9 million, an increase of approximately 33.4 per
cent from $34.4 million in the same quarter 2012. On a per guest basis, ancillary fees for the quarter increased by $2.11 or
26.4 per cent to $10.09 per guest, from $7.98 per guest during the fourth quarter of 2012. Quarter over quarter we
experienced improvements in ancillary revenue primarily associated with fare bundles and our Plus product offering.
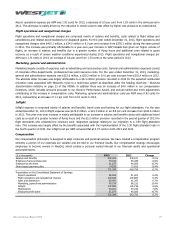
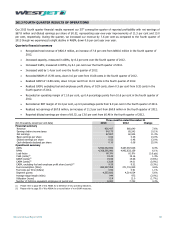
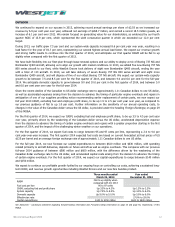
Operating expenses
Three months ended December 31
Expense (thousands) CASM (cents)
2013
2012
Change
2013
2012
Change
Aircraft fuel 260,528 246,216 5.8% 4.38 4.48 (2.2%)
Airport operations
115,938
109,895
5.5%
1.95
2.00
(2.5%)
Flight operations and navigational charges 100,565 94,408 6.5% 1.69 1.72 (1.7%)
Sales and distribution 94,267 81,499 15.7% 1.59 1.49 6.7%
Marketing, general and administration
64,562
57,505
12.3%
1.09
1.05
3.8%
Depreciation and amortization 52,168 46,175 13.0% 0.88 0.84 4.8%
Inflight 36,790 42,384 (13.2%) 0.62 0.77 (19.5%)
Aircraft leasing
42,462
43,729
(2.9%)
0.71
0.80
(11.3%)
Maintenance 44,999 35,590 26.4% 0.76 0.65 16.9%
Employee profit share 12,463 11,639 7.1% 0.21 0.21
Total operating expenses 824,742 769,040 7.2% 13.88 14.01 (0.9%)
Total, excluding fuel and profit share
551,751
511,185
7.9%
9.29
9.32
(0.3%)
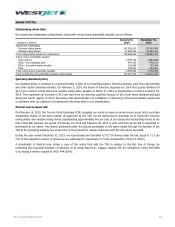
During the fourth quarter of 2013, operating expenses increased by 7.2 per cent to $824.7 million as compared to $769.0
million in 2012. This increase was primarily driven by the 8.3 per cent quarter-over-quarter increase in capacity. On an ASM
basis, operating expenses decreased by 0.9 per cent to 13.88 cents from 14.01 cents in 2012. Excluding fuel and employee
profit share, CASM decreased by only 0.3 per cent in 2013 to 9.29 cents as compared to 9.32 cents in 2012.