Westjet 2013 Annual Report Download - page 30
Download and view the complete annual report
Please find page 30 of the 2013 Westjet annual report below. You can navigate through the pages in the report by either clicking on the pages listed below, or by using the keyword search tool below to find specific information within the annual report.-
 1
1 -
2
-
3
-
4
-
5
-
6
-
7
-
8
-
9
-
10
-
11
-
12
-
13
-
14
-
15
-
16
-
17
-
18
-
19
-
 20
20 -
 21
21 -
 22
22 -
 23
23 -
 24
24 -
 25
25 -
 26
26 -
 27
27 -
 28
28 -
 29
29 -
 30
30 -
 31
31 -
 32
32 -
 33
33 -
 34
34 -
 35
35 -
 36
36 -
 37
37 -
 38
38 -
 39
39 -
 40
40 -
41
-
42
-
43
-
44
-
45
-
46
-
47
-
48
-
49
-
50
-
51
-
52
-
53
-
54
-
55
-
56
-
57
-
58
-
59
-
60
-
61
-
62
-
63
-
64
-
65
-
66
-
67
-
68
-
69
-
70
-
71
-
72
-
73
-
74
-
75
-
76
-
77
-
78
-
79
-
80
-
81
-
82
-
83
-
84
-
85
-
86
-
87
-
88
-
89
-
90
-
91
-
92
-
93
-
94
-
95
-
96
-
97
-
98
 |
 |

WestJet Annual Report 2013 30
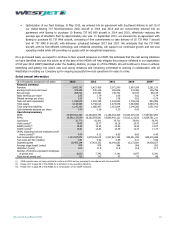
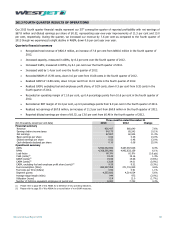
2013 FOURTH QUARTER RESULTS OF OPERATIONS
Our 2013 fourth quarter financial results represent our 35th consecutive quarter of reported profitability with net earnings of
$67.8 million and diluted earnings per share of $0.52, representing year-over-year improvements of 11.3 per cent and 13.0
per cent, respectively. During the quarter, we increased our revenue by 7.6 per cent as compared to the fourth quarter of
2012 though we experienced a slight decline in RASM, down 0.6 per cent year over year.
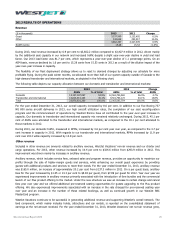
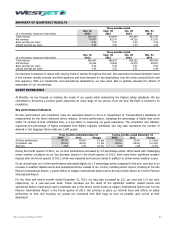
Quarterly financial summary
Recognized total revenue of $926.4 million, an increase of 7.6 per cent from $860.6 million in the fourth quarter of
2012.
Increased capacity, measured in ASMs, by 8.3 per cent over the fourth quarter of 2012.
Increased traffic, measured in RPMs, by 6.1 per cent over the fourth quarter of 2012.
Increased yield by 1.4 per cent over the fourth quarter of 2012.
Recorded RASM of 15.59 cents, down 0.6 per cent from 15.68 cents in the fourth quarter of 2012.
Realized CASM of 13.88 cents, down 0.9 per cent from 14.01 cents in the fourth quarter of 2012.
Realized CASM, excluding fuel and employee profit share, of 9.29 cents, down 0.3 per cent from 9.32 cents in the
fourth quarter of 2012.
Recorded an operating margin of 11.0 per cent, up 0.4 percentage points from 10.6 per cent in the fourth quarter of
2012.
Recorded an EBT margin of 10.2 per cent, up 0.3 percentage points from 9.9 per cent in the fourth quarter of 2012.
Realized net earnings of $67.8 million, an increase of 11.3 per cent from $60.9 million in the fourth quarter of 2012.
Reported diluted earnings per share of $0.52, up 13.0 per cent from $0.46 in the fourth quarter of 2012.
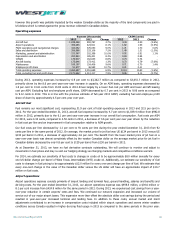
Three months ended December 31
($in thousands, except per unit data) 2013 2012 Change
Financial summary
Revenue 926,417 860,640 7.6%
Earnings before income taxes
94,173
85,543
10.1%
Net earnings
67,807
60,944
11.3%
Basic earnings per share 0.52 0.46 13.0%
Diluted earnings per share 0.52 0.46 13.0%
Cash dividends declared per share
0.10
0.08
25.0%
Operational summary
ASMs
5,942,032,692
5,487,467,646
8.3%
RPMs
4,768,595,990
4,492,833,159
6.1%
Load factor 80.3% 81.9% (1.6 pts)
Yield (cents)(i)
19.43
19.16
1.4%
RASM (cents)(i) 15.59 15.68 (0.6%)
CASM (cents)
(i)
13.88 14.01 (0.9%)
CASM, excluding fuel and employee profit share (cents)(ii)
9.29
9.32
(0.3%)
Fuel consumption (litres) 284,337,058 271,741,925 4.6%
Fuel costs per litre (dollars) 0.92 0.91 1.1%
Segment guests
4,557,606
4,314,024
5.6%
Average stage length (miles) 944 973 (3.0%)
Utilization (hours) 11.8 12.0 (1.7%)
Number of full-time equivalent employees at period end
8,000
7,742
3.3%
(i) Please refer to page 59 of this MD&A for a definition of key operating indicators.
(ii) Please refer to page 59 of this MD&A for a reconciliation of non-GAAP measures.