Westjet 2012 Annual Report Download - page 86
Download and view the complete annual report
Please find page 86 of the 2012 Westjet annual report below. You can navigate through the pages in the report by either clicking on the pages listed below, or by using the keyword search tool below to find specific information within the annual report.-
 1
1 -
2
-
3
-
4
-
5
-
6
-
7
-
8
-
9
-
10
-
11
-
12
-
13
-
14
-
15
-
16
-
17
-
18
-
19
-
20
-
21
-
22
-
23
-
24
-
25
-
26
-
27
-
28
-
29
-
30
-
31
-
32
-
33
-
34
-
35
-
36
-
37
-
38
-
39
-
40
-
41
-
42
-
43
-
44
-
45
-
46
-
47
-
48
-
49
-
50
-
51
-
52
-
53
-
54
-
55
-
56
-
57
-
58
-
59
-
60
-
61
-
62
-
63
-
64
-
65
-
66
-
67
-
68
-
69
-
70
-
71
-
72
-
73
-
74
-
75
-
 76
76 -
 77
77 -
 78
78 -
 79
79 -
 80
80 -
 81
81 -
 82
82 -
 83
83 -
 84
84 -
 85
85 -
 86
86 -
 87
87 -
 88
88 -
 89
89 -
 90
90 -
 91
91 -
 92
92 -
 93
93 -
 94
94 -
 95
95
 |
 |

Notes to Consolidated Financial Statements
For the years ended December 31, 2012 and 2011
(Stated in thousands of Canadian dollars, except share and per share amounts)
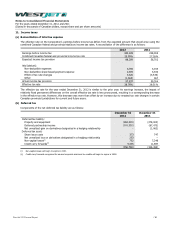
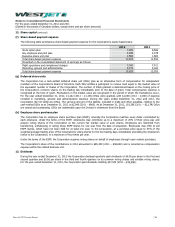
14. Earnings per share
The following reflects the share data used in the computation of basic and diluted earnings per share:
2012
2011
Weighted average number of shares outstanding – basic
Effect of dilution
Employee stock options
Key employee and pilot - Restricted share units
Executive - Restricted share units
Executive - Performance share units
Weighted average number of shares outstanding – diluted
For the year ended December 31, 2012, 734,448 employee stock options (2011 – 3,646,624) and 8,932 (2011 – nil) restricted
share units were not included in the calculation of dilutive potential shares as the result would have been anti-dilutive.
There have been no other transactions involving shares between the reporting date and the date of completion of these
statements.
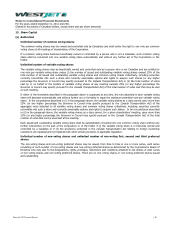
15. Finance income and cost
2012
2011
Finance income:
Interest on cash and cash equivalents
18,391
15,987
Note
2012
2011
Finance cost:
Interest on term loans and finance leases
46,887
55,833
Accretion on aircraft lease return obligations
9
2,013
5,078
48,900
60,911
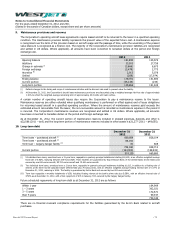
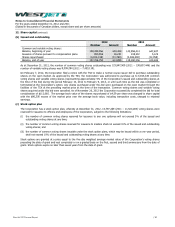
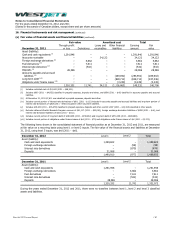
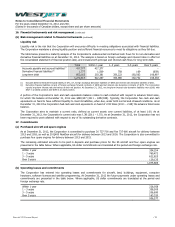
16. Financial instruments and risk management
(a) Fair value of financial assets and financial liabilities
The Corporation’s financial assets and liabilities consist primarily of cash and cash equivalents, restricted cash, accounts
receivable, derivative instruments designated and not designated in an effective hedging relationship, certain interest-bearing
deposits, accounts payable and accrued liabilities, long-term debt and obligations under finance leases. The following tables set
out the Corporation’s classification and carrying amount, together with the fair value, for each type of financial asset and
financial liability as at December 31, 2012 and 2011:
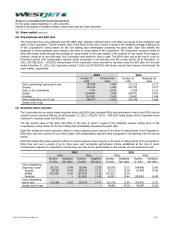
Fair value
Amortized cost
Total
December 31, 2012
Through profit
or loss
Derivatives
Loans and
receivables
Other financial
liabilities
Carrying
amount
Fair
value
Asset (liability):
Cash and cash equivalents (i)
1,459,822
–
–
–
1,459,822
1,459,822
Accounts receivable
–
–
37,576
–
37,576
37,576
Foreign exchange derivatives (ii)
–
(98)
–
–
(98)
(98)
Interest rate derivatives (iv)
–
(879)
–
–
(879)
(879)
Deposits (v)
31,088
–
–
–
31,088
31,088
Accounts payable and accrued
liabilities (vi)
–
–
–
(417,377)
(417,377)
(417,377)
Long-term debt (vii)
–
–
–
(739,048)
(739,048)
(810,640)
1,490,910
(977)
37,576
(1,156,425)
371,084
299,492
WestJet 2012 Annual Report
/ 86