Westjet 2012 Annual Report Download - page 30
Download and view the complete annual report
Please find page 30 of the 2012 Westjet annual report below. You can navigate through the pages in the report by either clicking on the pages listed below, or by using the keyword search tool below to find specific information within the annual report.-
 1
1 -
2
-
3
-
4
-
5
-
6
-
7
-
8
-
9
-
10
-
11
-
12
-
13
-
14
-
15
-
16
-
17
-
18
-
19
-
 20
20 -
 21
21 -
 22
22 -
 23
23 -
 24
24 -
 25
25 -
 26
26 -
 27
27 -
 28
28 -
 29
29 -
 30
30 -
 31
31 -
 32
32 -
 33
33 -
 34
34 -
 35
35 -
 36
36 -
 37
37 -
 38
38 -
 39
39 -
 40
40 -
41
-
42
-
43
-
44
-
45
-
46
-
47
-
48
-
49
-
50
-
51
-
52
-
53
-
54
-
55
-
56
-
57
-
58
-
59
-
60
-
61
-
62
-
63
-
64
-
65
-
66
-
67
-
68
-
69
-
70
-
71
-
72
-
73
-
74
-
75
-
76
-
77
-
78
-
79
-
80
-
81
-
82
-
83
-
84
-
85
-
86
-
87
-
88
-
89
-
90
-
91
-
92
-
93
-
94
-
95
 |
 |
WestJet 2012 Annual Report / 30
R
(
G
O
R
F
o
c
i
n
f
F
2
i
n
D
T
T
D
y
i
n
O
O
c
r
F
c
$
E
A
A
F
S
M
D
A
I
n
M
E
T
T
R
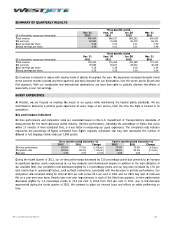
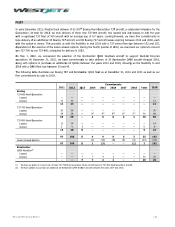
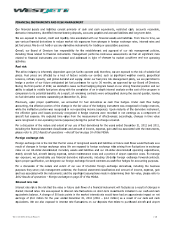
evenue
(
$ in thousands)
G
uest
O
ther
R
ASM (cents)
F
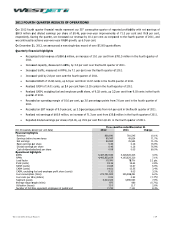
or the fourth
q
o
f 2011. On a
p
c
ompared to a
n
yield as well
f
rom 78.7 per
c
F
or the three
m
2
012, 48.5 per
n
crease versu
s
D
omestic
T
ransborder and
T
otal
D
uring the thr
e
y
ear-over-year
n
ternational tr
O
ther reven
u
O
ther revenue
c
omparable qu
r
evenue as we
l
F
or the three
m
c
ent from $31.
$
0.02 or 0.2 p
e
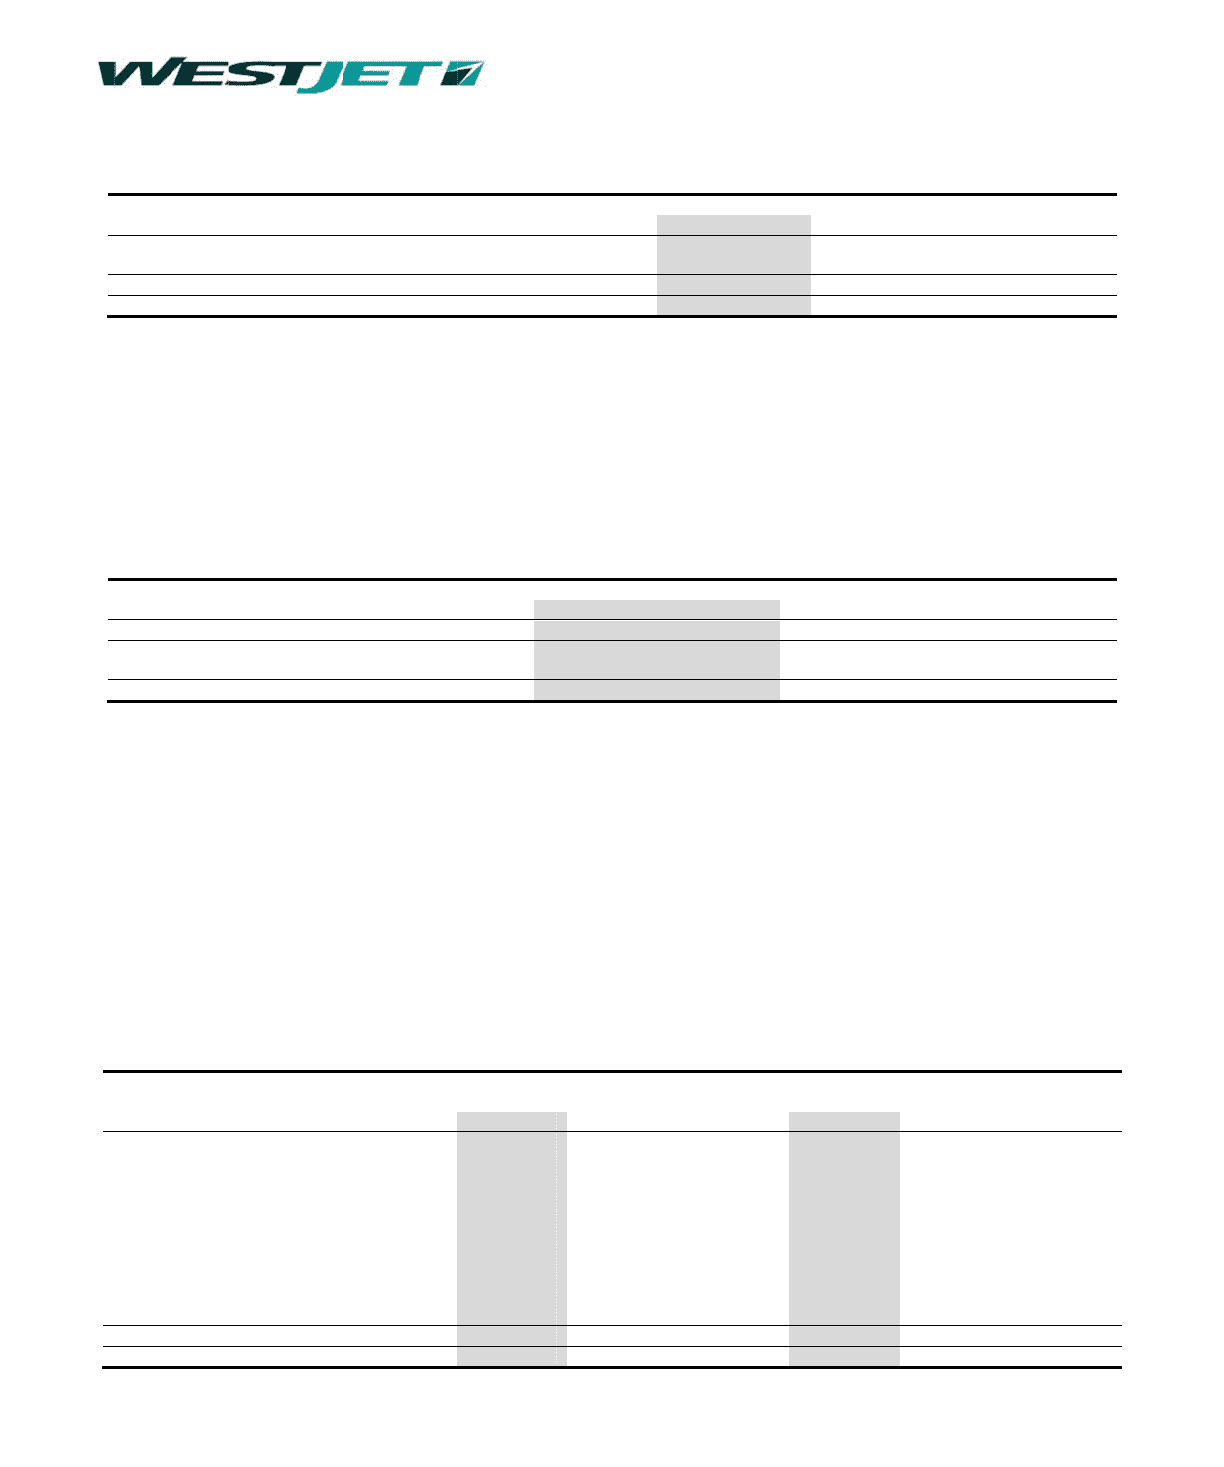
E
xpenses
A
ircraft fuel
A
irport operation
s
light operations
S
ales and distrib
u
M
arketing, gener
a
D
epreciation and
A
ircraft leasin
g
n
flight
M
aintenance
E
mployee profit
s
T
otal operatin
g
e
x
T
otal, excluding f
q
uarter of 201
2
p
er unit basis,
w
RASM of 14.6
7
as the increa
s
c
ent in the fou
r
m
onths ended
cent of ASMs
s
the same qu
a
international
e
e months en
d
as compared
affic increase
d
u
e
e
increased b
y
arter of 2011.
l
l as our ancill
a
m
onths ended
9 million in th
e
e
r cent to $7.9
8
s
and navigationa
l
u
tion
a
l and administr
a
amortization
hare
x
penses
uel and profit sh
2
, revenue inc
r
we saw an im
p
7
cents in the
s
e in load fact
o
r
th quarter of
2
December 31
were allocate
d
a
rter of 2011.
ded Decembe
r
to the 3.4 per
d
11.3 per cen
t
y
9.4 per cen
These impro
v
a
ry revenue.
December 31
,
e
same quart
e
8
per guest, fr
o
l
charges
a
tion
are
r
eased by 10.1
p
rovement in
R
same period o
f
o
r of 3.2 perce
2
011.
, 2012, overal
d
to the trans
b
2,8
2
2,6
6
5,4
8
r
31, 2012, o
u
cent decreas
e
t
, relatively in
t to $76.9 m
v
ements were
,
2012 ancillar
y
e
r 2011. On a
o
m $8.00 per
g
Exp
e
2012
246,216
118,051
91,242
76,509
59,690
46,175
43,729
40,199
35,590
11,639
769,040
511,185
per cent to $
8
R
ASM of 6.9 pe
f 2011. This i
n
ntage points t
o
l capacity incr
b
order and int
e
2012
ASMs
%
2
3,935,413
6
3,532,233
8
7,467,646
u
r domestic tr
a
e
in domestic
c
line with the i
n
illion for the
driven mainly
y revenue wa
s
per guest basi
g
uest during th
e
Thre
e
nse (thousan
d
2011
235,574
107,295
84,814
72,958
50,869
44,312
41,850
36,144
42,816
5,662
722,294
481,058
s
Three
m
2012
783,750
76,890
860,640
15.68
8
60.6 million f
r
r cent to 15.6
8
n
crease in RAS
M
o
a record fou
r
eased by 3.0
e
rnational mar
Three months
%
of total
51.5% 2
,
48.5% 2
,
100.0% 5
,
affic, measur
e
c
apacity. Our
c
n
crease in cap
a
fourth quarte
r
y
by improvem
s
$34.4 million
s, ancillary fe
e
e fourth quart
e
e
e months end
e
d
s)
Change
4.5%
10.0%
7.6%
4.9%
17.3%
4.2%
4.5%
11.2%
(16.9%)
105.6%
6.5%
6.3%
s
months ended
2011
71
1
7
0
78
1
r
om $781.5 mi
8
cents in the f
M was due to
rth quarter lo
a
per cent. Dur
i
r
kets, which r
e
ended Decem
b
201
1
ASMs
,
922,072,513
,
406,855,892
,
328,928,405
e
d in RPMs, i
n
c
harter and sc
a
city to these
r
of 2012, fr
o
ents in our W
n
, an increase
e
s for the qua
r
e
r of 2011.
e
d December
3
C
A
2012
4.48
2.15
1.66
1.40
1.09
0.84
0.80
0.73
0.65
0.21
14.01
9.32
s
December 31
C
h
1,246
0
,299
1,545
14.67
llion in the fou
f
ourth quarter
o
the 2.8 per ce
a
d factor of 81
i
ng the fourth
e
presents a 10
b
er 31
1
% of total
54.8%
45.2%
100.0%
n
creased by 3.
heduled trans
b
areas.
o
m $70.3 mill
W
estJet Vacatio
of approximat
e
r
ter decreased
3
1
A
SM (cents)
2011
4.42
2.01
1.59
1.37
0.96
0.83
0.79
0.68
0.80
0.10
13.55
9.03
│
h
ange
10.2%
9.4%
10.1%
6.9%
rth quarter
o
f 2012, as
nt increase
.9 per cent
quarter of
.7 per cent
Change
ASMs
(3.4%)
10.7%
3.0%
5 per cent
b
order and
ion in the
ns’ non-air
ely 7.8 per
slightly by
Change
1.4%
7.0%
4.4%
2.2%
13.5%
1.2%
1.3%
7.4%
(18.8%)
110.0%
3.4%
3.2%