Westjet 2012 Annual Report Download - page 57
Download and view the complete annual report
Please find page 57 of the 2012 Westjet annual report below. You can navigate through the pages in the report by either clicking on the pages listed below, or by using the keyword search tool below to find specific information within the annual report.-
 1
1 -
2
-
3
-
4
-
5
-
6
-
7
-
8
-
9
-
10
-
11
-
12
-
13
-
14
-
15
-
16
-
17
-
18
-
19
-
20
-
21
-
22
-
23
-
24
-
25
-
26
-
27
-
28
-
29
-
30
-
31
-
32
-
33
-
34
-
35
-
36
-
37
-
38
-
39
-
40
-
41
-
42
-
43
-
44
-
45
-
46
-
 47
47 -
 48
48 -
 49
49 -
 50
50 -
 51
51 -
 52
52 -
 53
53 -
 54
54 -
 55
55 -
 56
56 -
 57
57 -
 58
58 -
 59
59 -
 60
60 -
 61
61 -
 62
62 -
 63
63 -
 64
64 -
 65
65 -
 66
66 -
 67
67 -
68
-
69
-
70
-
71
-
72
-
73
-
74
-
75
-
76
-
77
-
78
-
79
-
80
-
81
-
82
-
83
-
84
-
85
-
86
-
87
-
88
-
89
-
90
-
91
-
92
-
93
-
94
-
95
 |
 |

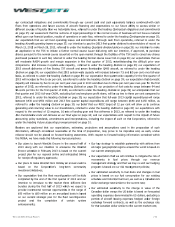
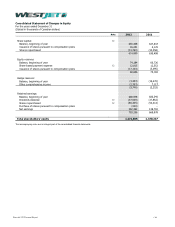
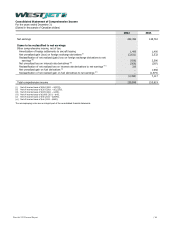
WestJet 2012 Annual Report / 57
R
(
E
A
I
R
(
(
(
(
O
(
C
W
D
F
(
C
A
W
D
R
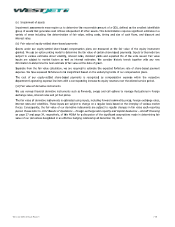
eturn on in
v
(
$ in thousands)
E
arnings before
i
A
dd:
Finance costs
Implicit intere
s
I
nvested capital:
Average long-t
Avera
g
e obli
ga
Average share
h
Off-balance-sh
R
eturn on invest
e
i) Interest implici
t
necessarily rep
r
ii) Average long-t
e
iii) Average obli
g
a
t
iv) Off-balance-sh
e
months of airc
r
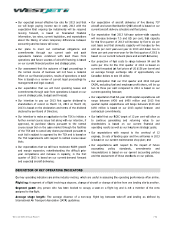
O
perating ca
s
(
$ in thousands,
C
ash flow from
o
W
eighted avera
g
D
iluted operatin
g
F
ree cash flo
w
(
$ in thousands,
C
ash flow from
o
A
djusted for:
Aircraft additi
o
Other propert
y
Free cash flow
W
eighted avera
g
D
iluted free cas
h
v
ested capita
l
i
ncome taxes
s
t in operating le
a
t
erm debt
(ii)
a
tions under fina
n
h
olders' equity
eet aircraft leas
e
e
d capital
t
in operating leas
e
r
esent actual for a
n
e
rm debt includes
t
t
ions under financ
e
e
et aircraft leases
a
r
aft leasin
g
costs t
o
s
h flow per s
h
except per shar
e
o
peratin
g
activiti
e
g
e number of sh
a
g
cash flow per s
w
except per shar
e
o
perating activiti
e
o
ns
y
and equipment
g
e number of sh
a
h
flow per share
l
ases
(i)
n
ce leases
(iii)
e
s
(i
v
)
e
s is equal to 7.0 p
e
n
y given period.
t
he current portion
e
leases include th
e
a
re calculated by
m
o
talled $173,412 (
D
h
ar
e
e
data)
e
s
a
res outstanding
s
hare
e
data)
e
s
and intangible
a
a
res outstanding
e
r cent of 7.5 time
s
and long-term po
r
e
current portion a
n
m
ultiplying the traili
n
D
ecember 31, 2011
- diluted
a
dditions
- diluted
s the trailing 12 m
o
r
tion.
n
d lon
g
-term porti
o
ng 12 months of ai
– $165,571).
s
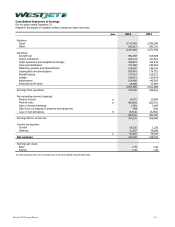
2012
340,229
48,900
91,041
480,170
783,880
1,625
1,421,261
1,300,590
3,507,356
13.7%
o
nths of aircraft le
a
o
n.
i
rcraft leasing exp
e
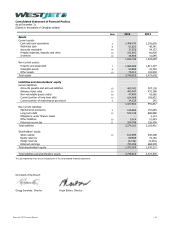
2012
721,634
135,964,118
5.31
2012
721,634
(218,116)
(51,191)
452,327
135,964,118
3.33
s
2011
208
,
60
,
86
,
355
,
927
,
3
,
1,337
,
1,241
,
3,510
,
10
a
se expense. 7.0 p
e
e
nse by 7.5. At De
c
2011
566
,
140,638
,
4
2011
566
,
(61,
2
(57,
1
448
,
140,638
,
3
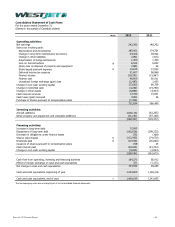
s
Ch
a
,
006
,
911
,
925
,
842
,
757
,
303
,
225
,
783
,
068
.1%
er cent is a proxy
a
c
ember 31, 2012, t
h
Ch
a
,
460
,
659 (
4
.03
Ch
a
,
460
2
65)
1
08)
,
087
,
659 (
3
.19
│
a
nge
132,223
(12,011)
4,116
124,328
(143,877)
(1,678)
84,036
58,807
(2,712)
3.6 pts.
a
nd does not
he trailing 12
a
nge
155,174
4,674,541)
31.8%
a
nge
155,174
(156,851)
5,917
4,240
4,674,541)
4.4%