Westjet 2012 Annual Report Download - page 29
Download and view the complete annual report
Please find page 29 of the 2012 Westjet annual report below. You can navigate through the pages in the report by either clicking on the pages listed below, or by using the keyword search tool below to find specific information within the annual report.-
 1
1 -
2
-
3
-
4
-
5
-
6
-
7
-
8
-
9
-
10
-
11
-
12
-
13
-
14
-
15
-
16
-
17
-
18
-
 19
19 -
 20
20 -
 21
21 -
 22
22 -
 23
23 -
 24
24 -
 25
25 -
 26
26 -
 27
27 -
 28
28 -
 29
29 -
 30
30 -
 31
31 -
 32
32 -
 33
33 -
 34
34 -
 35
35 -
 36
36 -
 37
37 -
 38
38 -
 39
39 -
40
-
41
-
42
-
43
-
44
-
45
-
46
-
47
-
48
-
49
-
50
-
51
-
52
-
53
-
54
-
55
-
56
-
57
-
58
-
59
-
60
-
61
-
62
-
63
-
64
-
65
-
66
-
67
-
68
-
69
-
70
-
71
-
72
-
73
-
74
-
75
-
76
-
77
-
78
-
79
-
80
-
81
-
82
-
83
-
84
-
85
-
86
-
87
-
88
-
89
-
90
-
91
-
92
-
93
-
94
-
95
 |
 |
WestJet 2012 Annual Report / 29
2
O
$
r
w
O
Q
(
F
O
A
Y
A
2
012 FOUR
T
O
ur 2012 fourt
$
60.9 million
a
r
espectively. D
u
w
e continued t
o
O
n December
2
Q
uarterly fin
a
Recog
2011.
Incre
a
Incre
a
Incre
a
Recor
d
Realiz
e
Realiz
e
quart
e
Recor
d
2011.
Recor
d
Realiz
e
Repor
t
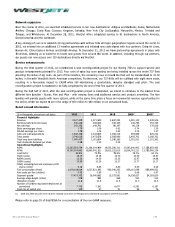
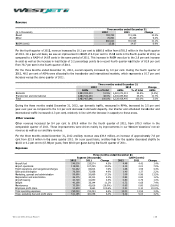
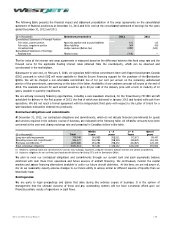
$in thousands,
e
F
inancial highli
Revenue
Earnings before
Net earnings
Basic earnings
p
Diluted earnin
gs
Cash dividends
d
O
perational hi
g
ASMs
RPMs
Load factor
Yield (cents)
RASM (cents)
CASM (cents)
CASM, excludin
g
Fuel consumptio
Fuel costs per li
t
Segment guests
Average stage l
e
Utilization (hour
s
Number of full-t
i
T
H QUARTE
R
t
h quarter fina
n
a
nd diluted ea
r
u
ring the quar
t
o
achieve year
-
2
1, 2012, we a
n
a
ncial highlig
nized total rev
e
a
sed capacity,
m
a
sed traffic, m
e
a
sed yield by 2
.
d
ed RASM of 1
e
d CASM of 14
e
d CASM, excl
u
e
r of 2011.
d
ed an operati
n
d
ed an EBT m
a
e
d net earning
s
t
ed diluted ear
e
xcept per unit d
ghts
income taxes
p
er share
s
per share
d
eclared per sh
a
g
hlights
g
fuel and emplo
y
o
n (litres)
t
re (dollars)
e
ngth (miles)
s
)
i
me equivalent e
R
RESULTS
O
n
cial results r
e
r
nings per sh
a
t
er, we increa
s
-
over-year RA
S
n
nounced a n
e
hts
e
nue of $860.
6
m
easured in A
S
e
asured in RPM
.
8 per cent ov
e
5.68 cents, up
.01 cents, up
3
u
ding fuel and
n
g margin of 1
a
rgin of 9.9 pe
r
s
of $60.9 milli
nings per shar
e
ata)
a
re
y
ee profit share
mployees at per
i
O
F OPERAT
I
e
present our 3
1
a
re of $0.46,
y
s
ed our reven
u
S
M growth, up
e
w single-day r
e
6
million, an in
c
S
Ms, by 3.0 pe
s, by 7.1 per
c
e
r the fourth q
u
6.9 per cent f
r
3
.4 per cent fr
o
employee prof
0.6 per cent,
u
r
cent, up 3.5
p
on, an increas
e
e
of $0.46, up
(cents)
i
od end
I
ONS
1
st
consecutive
y
ear-over-year
u
e by 10.1 per
6.9 per cent.
ecord of over
5
c
rease of 10.1
r cent over th
e
c
ent over the f
o
u
arter of 2011.
r
om 14.67 cen
t
o
m 13.55 cent
s
f
it share, of 9.
3
u
p 3.0 percent
a
p
ercentage poi
e
of 71.3 per
c
76.9 per cent
f
s
e
quarter of re
p
improvement
s
cent as comp
a
5
7,000 guests
f
per cent from
e
fourth quarte
o
urth quarter
o
t
s in the fourt
h
s
in the fourth
q
3
2 cents, up 3.
2
a
ge points fro
m
nts from 6.4 p
e
c
ent from $35.
6
f
rom $0.26 in
Three
m
2012
860,640
85,543
60,944
0.46
0.46
0.08
5,487,467,646
4,492,833,159
81.9%
19.16
15.68
14.01
9.32
271,741,925
0.91
4,314,024
973
12.0
7,742
s
p
orted profita
b
s
of 71.3 per
a
red to the fo
u
flown.
$781.5 million
r of 2011.
o
f 2011.
h
quarter of 20
quarter of 201
2
per cent fro
m
m
7.6 per cent
e
r cent in the
f
6
million in the
the fourth qu
a
m
onths ended
D
2011
781
49
35
5,328,928
4,193,629
7
8
1
1
1
255,906
3,996
7
s
b
ility with net
e
cent and 76.
9
u
rth quarter of
in the fourth
q
11.
1.
m
9.03 cents in
in the fourth q
f
ourth quarter
fourth quarte
r
a
rter of 2011.
D
ecember 31
Ch
a
,545
,834
,584
0.26
0.26
0.05
,405
,320
8
.7%
8.64
4.67
3.55
9.03
6
,491
0.92
,593
980
11.7
,141
│
e
arnings of
9
per cent,
f
2011, and
q
uarter of
n
the fourth
uarter of
of 2011.
r
of 2011.
a
nge
10.1%
71.7%
71.3%
76.9%
76.9%
60.0%
3.0%
7.1%
3.2 pts.
2.8%
6.9%
3.4%
3.2%
6.2%
(1.1%)
7.9%
(0.7%)
2.6%
8.4%