Westjet 2012 Annual Report Download - page 7
Download and view the complete annual report
Please find page 7 of the 2012 Westjet annual report below. You can navigate through the pages in the report by either clicking on the pages listed below, or by using the keyword search tool below to find specific information within the annual report.-
 1
1 -
 2
2 -
 3
3 -
 4
4 -
 5
5 -
 6
6 -
 7
7 -
 8
8 -
 9
9 -
 10
10 -
 11
11 -
 12
12 -
 13
13 -
 14
14 -
 15
15 -
 16
16 -
 17
17 -
 18
18 -
19
-
20
-
21
-
22
-
23
-
24
-
25
-
26
-
27
-
28
-
29
-
30
-
31
-
32
-
33
-
34
-
35
-
36
-
37
-
38
-
39
-
40
-
41
-
42
-
43
-
44
-
45
-
46
-
47
-
48
-
49
-
50
-
51
-
52
-
53
-
54
-
55
-
56
-
57
-
58
-
59
-
60
-
61
-
62
-
63
-
64
-
65
-
66
-
67
-
68
-
69
-
70
-
71
-
72
-
73
-
74
-
75
-
76
-
77
-
78
-
79
-
80
-
81
-
82
-
83
-
84
-
85
-
86
-
87
-
88
-
89
-
90
-
91
-
92
-
93
-
94
-
95
 |
 |

WestJet 2012 Annual Report / 7
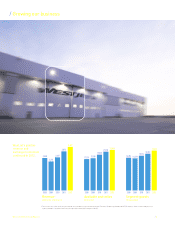
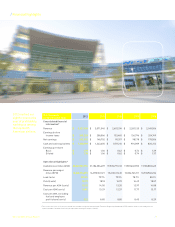
/ Financial highlights
* The results for 2010–2012 are presented in accordance with the International Financial Reporting Standards (IFRS) and the 2009 results and prior are
reported under Canadian Generally Accepted Accounting Principles (GAAP).
($ in thousands,
except per share data) 2012 2011 2010 2009 2008
Consolidated financial
information*
Revenue
Earnings before
income taxes
Net earnings
Cash and cash equivalents
Earnings per share
Basic
Diluted
Operational highlights*
Available seat miles (ASM)
Revenue passenger
miles (RPM)
Load factor
Yield (cents)
Revenue per ASM (cents)
Cost per ASM (cents)
Cost per ASM, excluding
fuel and employee
profit share (cents)
$ 3,427,409
$ 340,229
$ 242,392
$ 1,408,199
$ 1.79
$ 1.78
22,063,583,754
18,262,554,881
82.8%
18.77
15.53
13.83
9.12
$ 3,071,540
$ 208,006
$ 148,702
$ 1,243,605
$ 1.06
$ 1.06
21,186,304,409
16,890,941,121
79.7%
18.18
14.50
13.29
8.85
$ 2,607,294
$ 133,465
$ 90,197
$ 1,159,316
$ 0.62
$ 0.62
19,535,291,313
15,613,121,610
79.9%
16.70
13.35
12.37
8.80
$ 2,281,120
$ 136,796
$ 98,178
$ 994,989
$ 0.74
$ 0.74
17,587,640,902
13,834,761,211
78.7%
16.49
12.97
11.77
8.45
$ 2,549,506
$ 254,749
$ 178,506
$ 820,214
$ 1.39
$ 1.37
17,138,883,465
13,730,960,234
80.1%
18.57
14.88
13.17
8.29
2012 marked our
eighth consecutive
year of profitability,
ranking us among
the top North
American airlines.