Westjet 2012 Annual Report Download - page 20
Download and view the complete annual report
Please find page 20 of the 2012 Westjet annual report below. You can navigate through the pages in the report by either clicking on the pages listed below, or by using the keyword search tool below to find specific information within the annual report.-
 1
1 -
2
-
3
-
4
-
5
-
6
-
7
-
8
-
9
-
 10
10 -
 11
11 -
 12
12 -
 13
13 -
 14
14 -
 15
15 -
 16
16 -
 17
17 -
 18
18 -
 19
19 -
 20
20 -
 21
21 -
 22
22 -
 23
23 -
 24
24 -
 25
25 -
 26
26 -
 27
27 -
 28
28 -
 29
29 -
 30
30 -
31
-
32
-
33
-
34
-
35
-
36
-
37
-
38
-
39
-
40
-
41
-
42
-
43
-
44
-
45
-
46
-
47
-
48
-
49
-
50
-
51
-
52
-
53
-
54
-
55
-
56
-
57
-
58
-
59
-
60
-
61
-
62
-
63
-
64
-
65
-
66
-
67
-
68
-
69
-
70
-
71
-
72
-
73
-
74
-
75
-
76
-
77
-
78
-
79
-
80
-
81
-
82
-
83
-
84
-
85
-
86
-
87
-
88
-
89
-
90
-
91
-
92
-
93
-
94
-
95
 |
 |

WestJet 2012 Annual Report / 20
A
W
d
s
c
p
e
m
I
w
a
m
y
p
2
A
NNUAL OV
W
e achieved r
e
d
emonstrating
s
ixteenth time
c
ent to end th
e
p
er cent on a
e
xtremely plea
s
m
argins of 11.
0
n 2012, we e
x
w
e announced
a
ttract the bus
m
illion to our
s
y
ears to $290.
6
p
oints compar
e
2
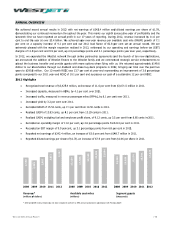
012 Highlig
h
Recog
Incre
a
Incre
a
Incre
a
Recor
d
Realiz
e
Realiz
e
Recor
d
Recor
d
Repor
t
Repor
t
* 2008 and
2
2,550
2008 2
Revenu
e
(millions
o
E
RVIEW
e
cord annual
our continued
we have repo
r
e
year at over
capacity incre
a
s
ed with the
m
0
per cent and
x
panded the
W
the addition
o
iness traveller
s
hareholders t
h
6
million. Our
e
d to our 2011
h
ts
nized total rev
e
a
sed capacity,
m
a
sed traffic, m
e
a
sed yield by 3
.
d
ed RASM of 1
e
d CASM of 13
e
d CASM, excl
u
d
ed an operati
n
d
ed an EBT m
a
t
ed net earnin
g
t
ed diluted ear
2
009 revenue totals h
a
2,281
2,607
009 2010
2
e
*
o
fdollars)
results in 201
2
momentum t
h
r
ted an annua
l
$3.4 billion.
W
a
se of 4.1 pe
r
m
argin expans
9.9 per cent,
u
W
estJet networ
k
o
f WestJet Enc
o
and provide
g
h
rough our div
i
12-month RO
I
year-end ROI
C
e
nue of $3,42
7
m
easured in A
S
e
asured in rev
e
.
2 per cent ov
e
5.53 cents, up
.83 cents, up
4
u
ding fuel and
n
g margin of 1
a
rgin of 9.9 pe
r
g
s of $242.4 m
nings per shar
e
a
ve not been restated
3,072
3,427
2
011 2012
2 with net ea
r
roughout the
y
l
profit in our
W
e achieved y
e
r
cent and ou
r
ion realized in
u
p 2.6 percent
a
k
through airli
n
ore to the We
s
g
uests with m
o
i
dend and sha
r
I
C was 13.7 p
e
C
of 10.1 per c
e
7
.4 million, an
i
S
Ms, by 4.1 pe
nue passenge
r
e
r 2011.
7.1 per cent f
r
4
.1 per cent fr
o
employee prof
1.0 per cent,
u
r
cent, up 3.1
p
illion, an incre
a
e
of $1.78, an
to conform to IFRS a
17,139
17,588
2008 200
9
Available
(millions)
rnings of $24
2
y
ear. This mar
17-years of re
e
ar-over-year r
e
r
2012 load fa
2012, eviden
c
a
ge points and
n
e partnership
stJet family a
n
o
re options wh
e
r
e buy-back pr
e
r cent at year
e
nt and surpas
increase of 11.
r cent over 20
1
r
miles (RPMs)
,
r
om 14.50 cen
t
o
m 13.29 cent
s
f
it share, of 9.
1
u
p 2.6 percent
a
p
ercentage poi
a
se of 63.0 pe
r
increase of 67
nd are presented in a
c
19,535
21,186
9
2010 201
1
seatmiles
2
.4 million an
d
ks our eighth
c
porting. Durin
g
evenue per a
v
a
ctor of 82.8
p
ced by our o
p
3.1 percentag
agreements
a
n
d we comme
n
en flying with
r
ograms in 20
1
r
-end represen
t
s
ses our goal o
f
.
6 per cent fro
m
1
1.
,
by 8.1 per ce
n
t
s in 2011.
s
in 2011.
1
2 cents, up 3.
1
a
ge points fro
m
nts from 6.8 p
e
r
cent from $1
4
.9 per cent fro
m
c
cordance with Previo
22,064
1
2012
2
y
d
diluted earn
i
c
onsecutive ye
g
2012, reven
u
v
ailable seat m
p
er cent set a
n
p
erating and e
a
e points year
o
a
nd the launch
n
ced strategic
us. We retur
n
1
2, bringing o
u
ting an impro
v
f
a sustainable
m
$3,071.5 mi
l
nt over 2011.
1 per cent fro
m
m
8.4 per cent
e
r cent in 201
1
4
8.7 million in
m $1.06 per s
h
o
us GAAP.
14,284
14,039
2
008 2009
2
Segmentgu
e
(thousands)
e
ings per shar
e
e
ar of profitabil
u
e increased
b
ile (RASM) gr
o
n
annual reco
r
arnings befor
e
o
ver year, res
p
of ten new d
e
service enhan
c
n
ed approxima
t
u
r total over t
h
v
ement of 3.6
p
12 per cent R
O
l
lion in 2011.
m
8.85 cents in
in 2011.
1
.
2011.
h
are in 2011.
15,174
16,041
2
010 2011
2
e
sts
│
e
of $1.78,
ity and the
b
y 11.6 per
o
wth of 7.1
r
d. We are
e
tax (EBT)
p
ectively.
e
stinations,
c
ements to
t
ely $149.6
h
e past two
percentage
O
IC.
n
2011.
17,423
2
012