Westjet 2012 Annual Report Download - page 80
Download and view the complete annual report
Please find page 80 of the 2012 Westjet annual report below. You can navigate through the pages in the report by either clicking on the pages listed below, or by using the keyword search tool below to find specific information within the annual report.-
 1
1 -
2
-
3
-
4
-
5
-
6
-
7
-
8
-
9
-
10
-
11
-
12
-
13
-
14
-
15
-
16
-
17
-
18
-
19
-
20
-
21
-
22
-
23
-
24
-
25
-
26
-
27
-
28
-
29
-
30
-
31
-
32
-
33
-
34
-
35
-
36
-
37
-
38
-
39
-
40
-
41
-
42
-
43
-
44
-
45
-
46
-
47
-
48
-
49
-
50
-
51
-
52
-
53
-
54
-
55
-
56
-
57
-
58
-
59
-
60
-
61
-
62
-
63
-
64
-
65
-
66
-
67
-
68
-
69
-
 70
70 -
 71
71 -
 72
72 -
 73
73 -
 74
74 -
 75
75 -
 76
76 -
 77
77 -
 78
78 -
 79
79 -
 80
80 -
 81
81 -
 82
82 -
 83
83 -
 84
84 -
 85
85 -
 86
86 -
 87
87 -
 88
88 -
 89
89 -
 90
90 -
91
-
92
-
93
-
94
-
95
 |
 |

Notes to Consolidated Financial Statements
For the years ended December 31, 2012 and 2011
(Stated in thousands of Canadian dollars, except share and per share amounts)
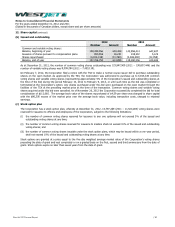
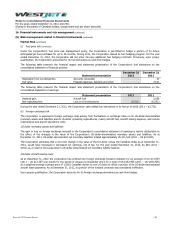
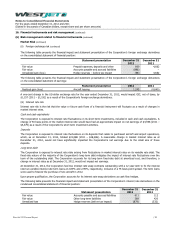
11. Income taxes
(a) Reconciliation of total tax expense
The effective rate on the Corporation’s earnings before income tax differs from the expected amount that would arise using the
combined Canadian federal and provincial statutory income tax rates. A reconciliation of the difference is as follows:
2012
2011
Earnings before income tax
340,229
208,006
Combined Canadian federal and provincial income tax rate
25.95%
27.26%
Expected income tax provision
88,289
56,702
Add (deduct):
Non-deductible expenses
3,709
3,344
Non-deductible share-based payment expense
2,978
3,430
Effect of tax rate changes
4,426
(4,539)
Other
(1,565)
367
Actual income tax provision
97,837
59,304
Effective tax rate
28.76%
28.51%
The effective tax rate for the year ended December 31, 2012 is similar to the prior year. As earnings increase, the impact of
relatively fixed permanent differences on the overall effective tax rate is less pronounced, resulting in a corresponding decrease
in the effective tax rate. However, this decrease was more than offset by an increase due to enacted tax rate changes in certain
Canadian provincial jurisdictions for current and future years.
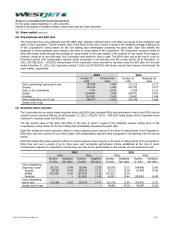
(b) Deferred tax
Components of the net deferred tax liability are as follows:
December 31
2012
December 31
2011
Deferred tax liability:
Property and equipment
(262,219)
(278,003)
Deferred partnership income
(101,352)
(67,473)
Net unrealized gain on derivatives designated in a hedging relationship
(1,062)
Deferred tax asset:
Share issue costs
373
747
Net unrealized loss on derivatives designated in a hedging relationship
253
−
Non-capital losses(i)
752
7,348
Credit carry forwards(ii)
5,445
11,987
(356,748)
(326,456)
(i) Non-capital losses will begin to expire in 2030.
(ii) Credit carry forwards recognized for unused corporate minimum tax credits will begin to expire in 2028.
WestJet 2012 Annual Report
/ 80