Westjet 2012 Annual Report Download - page 32
Download and view the complete annual report
Please find page 32 of the 2012 Westjet annual report below. You can navigate through the pages in the report by either clicking on the pages listed below, or by using the keyword search tool below to find specific information within the annual report.-
 1
1 -
2
-
3
-
4
-
5
-
6
-
7
-
8
-
9
-
10
-
11
-
12
-
13
-
14
-
15
-
16
-
17
-
18
-
19
-
20
-
21
-
 22
22 -
 23
23 -
 24
24 -
 25
25 -
 26
26 -
 27
27 -
 28
28 -
 29
29 -
 30
30 -
 31
31 -
 32
32 -
 33
33 -
 34
34 -
 35
35 -
 36
36 -
 37
37 -
 38
38 -
 39
39 -
 40
40 -
 41
41 -
 42
42 -
43
-
44
-
45
-
46
-
47
-
48
-
49
-
50
-
51
-
52
-
53
-
54
-
55
-
56
-
57
-
58
-
59
-
60
-
61
-
62
-
63
-
64
-
65
-
66
-
67
-
68
-
69
-
70
-
71
-
72
-
73
-
74
-
75
-
76
-
77
-
78
-
79
-
80
-
81
-
82
-
83
-
84
-
85
-
86
-
87
-
88
-
89
-
90
-
91
-
92
-
93
-
94
-
95
 |
 |

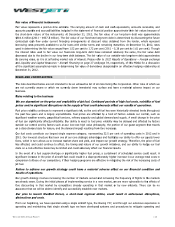
WestJet 2012 Annual Report / 32
S
(
T
N
B
D
(
T
N
B
D
O
i
n
f
s
G
A
c
c
K
O
m
w
r
d
O
C
B
D
i
n
o
c
c
f
d
e
t
S
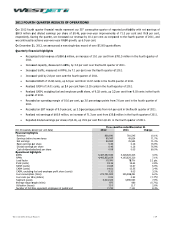
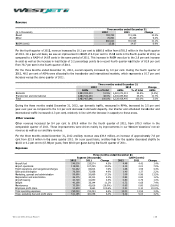
UMMARY
O
(
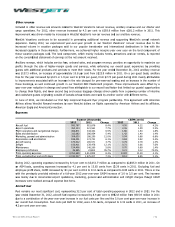
$ in thousands,
T
otal revenue
N
et earnings
B
asic earnin
g
s p
e
D
iluted earnings
(
$ in thousands,
T
otal revenue
N
et earnings
B
asic earnings p
e
D
iluted earnings
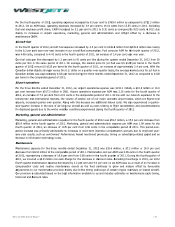
O
ur business is
n
the summer
f
irst quarters).
s
easonality on
o
G
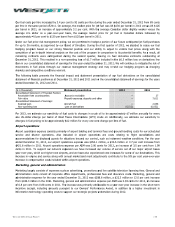
UEST EXP
E
A
t WestJet, w
e
c
ommitted to
d
c
ompletion.
K
ey perform
a
O
n-time perfor
m
easurement
f
w
ithin 15 minu
r
epresents the
d
elayed or lost
O
n-time perform
C
ompletion rate
B
ag ratio
D
uring the fou
r
n
significant
w
o
ur available fl
e
c
ent mainly du
e
c
ompletion rat
e
f
lat on a year-
o
d
ecreased slig
h
e
xperienced d
u
ime.
O
F QUARTE
R
except per shar
e
e
r share
per share
except per shar
e
e
r share
per share
seasonal in n
a
months (seco
n
With our tra
n
o
ur net earnin
g
E
RIENCE
e
are focused
d
elivering a p
o
a
nce indicato
r
mance and c
o
f
or the North
A
tes of their sc
percentage o
f
baggage clai
m
ance
r
th quarter of
2
w
eather events
e
et. Our comp
e
to operation
a
e
remained str
o
o
ver-year basi
s
h
tly by 1.4 p
e
u
ring the fourt
h
R
LY RESULT
e
data)
e
data)
a
ture with vary
n
d and third q
u
n
sborder and i
n
g
s.
on meeting t
h
o
sitive guest e
x
r
s
o
mpletion rate
s
A
merican airli
n
heduled time,
f flights comp
m
s made per 1,
0
Three
2012
64.
0
98.
5
2.
2
012, our on-ti
m
experienced
a
letion rate de
c
a
l factors, suc
h
o
ng for 2012
a
s
. Despite year
e
rcentage poin
t
h
quarter of 2
0
S
y
ing levels of a
c
u
arters) and
m
nternational d
e
h
e needs of o
x
perience at e
v
s
are calculat
e
n
e industry. O
n
is a key facto
r
leted from fli
g
0
00 guests.
months ende
d
2011
0
% 77
5
% 99
94
2
me performan
c
a
t our key do
m
c
reased slightl
y
h
as flight con
n
a
t 98.9 per ce
n
-over-year im
p
ts to 75.4 pe
r
0
12. We conti
n
Dec. 31
2012
860,640
60,944
0.46
0.46
Dec. 31
2011
781,545
35,584
0.26
0.26
c
tivity through
o
m
ore demand f
o
e
stinations, w
e
ur guests whil
v
ery stage of
o
e
d based on t
h
n
-time perfor
m
r
in measuring
g
hts originally
d
December 31
Chan
g
.9% (13.
9
.5% (1.
0
2
.50
1
c
e decreased
b
m
estic and inte
r
y
by 1.0 perce
n
n
ections, asso
c
n
t versus 99.3
p
rovements in
r
cent in 201
2
n
ue to place o
s
Three
m
Sept. 30
2012
866,5
70,6
4
0.
0.
Three
m
Sept. 30
2011
775,2
39,2
0.
0.
o
ut the year.
W
o
r sun destina
t
e
have been
a
l
e maintaining
our service, fr
o
h
e U.S. Depar
t
m
ance, indicati
n
g
our guest ex
p
scheduled. O
u
1
T
w
g
e 20
9
pts.)
0
pts.)
1
7.6%
b
y 13.9 percen
t
r
national airp
o
n
tage points a
c
iated with th
e
per cent in 20
each of the fi
r
2
from 76.8 p
o
ur internal fo
c
s
m
onths ended
Jun.
3
201
2
37 8
0
48
4
53
52
m
onths ended
Jun.
3
201
1
85 7
4
67
2
28
28
W
e experience
t
ions over the
w
a
ble to partiall
y
the highest
s
om the time t
t
ment of Tran
n
g the percen
t
p
erience. The
u
r bag ratio r
e
w
elve months
e
0
12
2
75.4%
98.9%
2.68
t
age points du
e
o
rts in addition
nd our bag ra
t
e
decrease in
o
0
11 and our 2
0
r
st three quart
e
p
er cent in 20
c
us and efforts
s
3
0
2
M
a
2
0
9,282
4
2,479
0.31
0.31
3
0
1
M
a
2
4
2,288
2
5,602
0.18
0.18
increased do
m
w
inter period
(
y alleviate th
e
s
afety standar
d
he flight is bo
sportation’s st
t
age of flights
completion ra
t
e
presents the
e
nded Decem
b
2
011
C
76.8%
99.3%
2.68
e primarily to
a
to the high u
t
t
io increased
b
o
n-time perfor
m
0
12 bag ratio
o
e
rs, on-time p
e
11, due to th
e
on safely per
f
│
ar. 31
2
012
890,950
68,321
0.50
0.49
ar. 31
2
011
772,422
48,249
0.34
0.34
m
estic travel
(
fourth and
e
effects of
d
s. We are
oked to its
t
andards of
that arrive
t
e indicator
number of
b
er 31
C
hange
(1.4 pts.)
(0.4 pts.)
―
a
n increase
t
ilization of
b
y 17.6 per
m
ance. Our
o
f 2.68 was
e
rformance
e
decrease
f
orming on