Westjet 2012 Annual Report Download - page 24
Download and view the complete annual report
Please find page 24 of the 2012 Westjet annual report below. You can navigate through the pages in the report by either clicking on the pages listed below, or by using the keyword search tool below to find specific information within the annual report.-
 1
1 -
2
-
3
-
4
-
5
-
6
-
7
-
8
-
9
-
10
-
11
-
12
-
13
-
 14
14 -
 15
15 -
 16
16 -
 17
17 -
 18
18 -
 19
19 -
 20
20 -
 21
21 -
 22
22 -
 23
23 -
 24
24 -
 25
25 -
 26
26 -
 27
27 -
 28
28 -
 29
29 -
 30
30 -
 31
31 -
 32
32 -
 33
33 -
 34
34 -
35
-
36
-
37
-
38
-
39
-
40
-
41
-
42
-
43
-
44
-
45
-
46
-
47
-
48
-
49
-
50
-
51
-
52
-
53
-
54
-
55
-
56
-
57
-
58
-
59
-
60
-
61
-
62
-
63
-
64
-
65
-
66
-
67
-
68
-
69
-
70
-
71
-
72
-
73
-
74
-
75
-
76
-
77
-
78
-
79
-
80
-
81
-
82
-
83
-
84
-
85
-
86
-
87
-
88
-
89
-
90
-
91
-
92
-
93
-
94
-
95
 |
 |

WestJet 2012 Annual Report / 24
O
I
c
i
m
W
e
i
n
i
n
t
o
A
p
g
w
f
t
t
y
t
a
I
A
A
E
A
A
F
S
M
D
A
I
M
E
T
T
D
a
e
w
w
i
n
A
F
y
d
o
4
O
the
r
reven
ue
ncluded in ot
h
c
argo operatio
n
m
provement
w
W
estJet Vacati
e
xpansion. Du
r
n
creased volu
n
creased cap
a
hese vacation
o
n the consoli
d
A
ncillary reven
u
p
rofits through
g
uests with ad
d
w
as $137.3 mi
l
f
ees for the ye
a
o improvemen
hese booking
s
y
ear-over-year
o change thei
r
a
nd codeshare
n June of 201
A
irlines allows
A
merican Eagl
e
E
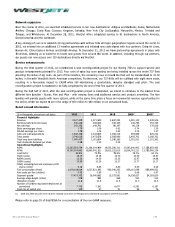
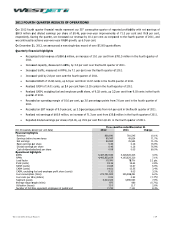
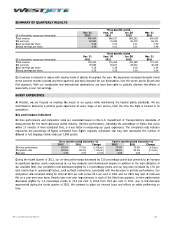
xpenses
A
ircraft fuel
A
irport operatio
n
F
light operations
S
ales and distrib
u
M
arketin
g
,
g
ene
r
D
epreciation an
d
A
ircraft leasing
I
nflight
M
aintenance
E
mployee profit
s
T
otal operating
e
T
otal, excluding
f
D
uring 2012, o
a
n ASM basis,
e
mployee profi
t
w
ith the previ
o
w
as mainly du
e
n
creases were
A
ircraft fuel
F
uel remains o
y
ear ended De
c
d
ue to a combi
o
ur overall fuel
4
.2 per cent ye
ue
h
er revenue ar
e
n
s. For 2012,
w
as driven mai
n
ons continues
r
ing 2012, we
me in vacatio
a
city in those
m
packages sol
d
d
ated stateme
n
u
e, which incl
u
the sale of
h
d
itional produ
c
l
lion, an incre
a
a
r increased b
y
ts associated
w
s
, as well cont
reduction in c
h
r
flights, and l
o
guests origina
t
2, we introdu
c
WestJet Rewa
e
and America
n
n
s
and navigation
a
u
tion
r
al and administ
r
d
amortization
s
hare
e
xpenses
f
uel and profit s
h
perating expe
n
operating exp
t
share, CASM
o
usly provided
e
to incremen
t
realized acros
s
ur most signifi
c
ember 31, 20
nation of the
y
consumption.
ar over year.
e
amounts rel
a
other revenu
e
n
ly by increase
s
to be succes
experienced
o
n packages s
o
m
arkets. Furt
h
d
. The land c
o
n
t of earnings
u
des service fe
e
h
igher-margin
c
ts and servic
e
a
se of approxi
m
y
$0.15 or 1.9
w
ith an increa
s
inued growth
h
ange and can
o
wer second b
t
ing outside of
c
ed our first f
u
rd members t
o
n
Connection.
a
l charges
r
ation
h
are
n
ses increased
enses increas
e
increased by
3
estimate of a
t
al airport ope
r
s
all expense li
n
cant cost, rep
r
12, aircraft fu
e
y
ear-over-year
Fuel costs pe
r
a
ted to WestJe
e
increased by
s in WestJet V
a
sful in gener
a
year-over-yea
old to our po
h
ermore, we a
o
mponent, wh
i
at the net am
o
e
s, onboard sa
goods and se
r
e
s to meet the
m
ately 10.8 p
e
per cent to $7
s
e in the rate
in our WestJe
t
cel fees attrib
u
ag and excess
Canada whos
e
u
lly reciprocal
f
o
earn WestJ
e
Exp
e
2012
992,787
454,114
366,871
313,082
208,620
185,401
173,412
156,411
154,406
46,585
3,051,689
2,012,317
by 8.4 per ce
e
d by 4.1 per
3
.1 per cent in
2
full-year 2012
r
ations, marke
t
ne items.
r
esenting 32.5
e
l expense incr
increase in ou
r
ASM for 201
2
t Vacation’s n
o
4.5 per cent
a
cation’s non-
a
a
ting additiona
r growth in
o
pular transbo
r
chieved highe
i
ch mainly incl
o
unt received.
les, and progr
a
rvices, while
e
ir needs. For t
e
r cent from $
1
.89 per guest,
charged for pr
t
RBC Master
c
u
table to our r
e
baggage char
e
tickets were
s
f
requent flyer
t dollars on fli
e
nse (thousan
d
2011
915,878
421,561
344,442
296,954
186,290
174,751
165,571
139,478
146,260
23,804
2,814,989
1,875,307
nt to $3,051.7
cent to 13.83
2012 to 9.12 c
e
year-over-yea
ting, general
a
per cent of t
o
eased by 8.4
p
r fuel costs pe
2
, were 4.50 c
e
o
n-air revenue
,
to $293.9 mil
a
ir revenue an
d
l revenue an
d
o
ur WestJet V
r
der and inte
r
r margins yea
l
udes hotels,
a
a
m revenue, p
e
nhancing our
t
he year ende
d
123.9 million i
n
from $7.74 p
e
r
e-reserved se
a
c
ard program.
e
cord load fact
r
ges driven pa
r
s
old by anothe
program part
n
i
ghts operated
d
s)
Change
8.4%
7.7%
6.5%
5.4%
12.0%
6.1%
4.7%
12.1%
5.6%
95.7%
8.4%
7.3%
7
million as co
m
cents from 1
3
ents as compa
r CASM increa
a
nd administra
o
tal operating
e
p
er cent to $9
9
e
r litre and the
ents, compare
y
, ancillary rev
e
l
lion from $28
d
our ancillary
d
supporting
W
V
acations’ non
-
r
national dest
i
r over year o
n
a
ttractions an
d
p
rovides an op
p
overall guest
d
December 3
1
n
2011. On a
e
r guest durin
g
a
ting and an i
n
These improv
e
t
or that limited
r
tly from a gr
o
r carrier with
d
n
ership. This
a
by American
C
A
2012
4.50
2.06
1.66
1.42
0.94
0.84
0.79
0.71
0.70
0.21
13.83
9.12
m
pared to $2,
8
3
.29 cents in
2
a
red to 8.85 ce
n
se of 3.0 to 3
.
a
tion and inflig
expenses in 2
0
9
2.8 million fr
o
5.0 per cent
y
d to 4.32 cent
e
e
nue and our
c
1.2 million in
revenue.
W
estJet’s over
a
-
air revenue
d
i
nations in lin
e
n
the land co
m
d
car rentals,
i
p
ortunity to m
a
experience b
y
1
, 2012 ancilla
per guest bas
i
g
2011 mainly
a
n
crease in the
e
ments were
o
our guests’ o
p
o
wing number
d
ifferent terms
.
a
greement wit
h
Airlines and it
A
SM (cents)
2011
4.32
1.99
1.63
1.40
0.88
0.82
0.78
0.66
0.69
0.12
13.29
8.85
8
15.0 million i
n
2
011. Excludi
n
n
ts in 2011. T
h
.
5 per cent. T
h
ht charges th
o
0
12 and in 20
1
o
m $915.9 mill
i
y
ear-over-year
t
s in 2011, an
│
c
harter and
2011. This
a
ll network
d
ue to the
e
with the
m
ponent of
i
s reported
a
ximize our
y
providing
ry revenue
i
s, ancillary
a
ttributable
number of
o
ffset by a
p
portunities
of interline
.
h
American
t
s affiliates,
Change
4.2%
3.5%
1.8%
1.4%
6.8%
2.4%
1.3%
7.6%
1.4%
75.0%
4.1%
3.1%
n
2011. On
n
g fuel and
h
is is in line
h
e increase
o
ugh CASM
1
1. For the
i
on in 2011
increase in
increase of