TCF Bank 2013 Annual Report Download - page 9
Download and view the complete annual report
Please find page 9 of the 2013 TCF Bank annual report below. You can navigate through the pages in the report by either clicking on the pages listed below, or by using the keyword search tool below to find specific information within the annual report.-
 1
1 -
 2
2 -
 3
3 -
 4
4 -
 5
5 -
 6
6 -
 7
7 -
 8
8 -
 9
9 -
 10
10 -
 11
11 -
 12
12 -
 13
13 -
 14
14 -
 15
15 -
 16
16 -
 17
17 -
 18
18 -
 19
19 -
 20
20 -
21
-
22
-
23
-
24
-
25
-
26
-
27
-
28
-
29
-
30
-
31
-
32
-
33
-
34
-
35
-
36
-
37
-
38
-
39
-
40
-
41
-
42
-
43
-
44
-
45
-
46
-
47
-
48
-
49
-
50
-
51
-
52
-
53
-
54
-
55
-
56
-
57
-
58
-
59
-
60
-
61
-
62
-
63
-
64
-
65
-
66
-
67
-
68
-
69
-
70
-
71
-
72
-
73
-
74
-
75
-
76
-
77
-
78
-
79
-
80
-
81
-
82
-
83
-
84
-
85
-
86
-
87
-
88
-
89
-
90
-
91
-
92
-
93
-
94
-
95
-
96
-
97
-
98
-
99
-
100
-
101
-
102
-
103
-
104
-
105
-
106
-
107
-
108
-
109
-
110
-
111
-
112
-
113
-
114
-
115
-
116
-
117
-
118
-
119
-
120
-
121
-
122
-
123
-
124
-
125
-
126
-
127
-
128
-
129
-
130
-
131
-
132
-
133
-
134
-
135
-
136
-
137
-
138
-
139
 |
 |

average yield of 6.03 percent and has
maintained very strong credit quality
metrics. TCF entered the inventory
finance business in 2008 and now
has a well-diversified portfolio with
loans in the powersports, lawn and
garden, electronics and appliance,
recreational vehicle, marine and
specialty vehicle markets.
The inventory finance business is
unique in the banking industry given
its steep barriers to entry including
industry expertise. TCF Inventory
Finance’s experienced management
team and customer service focus have
resulted in relationships with several
industry-leading manufacturers
including BRP, The Toro Company
and Arctic Cat, Inc. Celebrating its
five-year anniversary in 2013, TCF
Inventory Finance continued its
focus on customer service while
strengthening its relationships with
its manufacturers. We continue to look
at opportunities to add additional
programs and expect to continue to
grow the business going forward.
TCF’s leasing and equipment finance
businesses continue to be a key part
of the TCF lending story. Leasing and
equipment finance ended the year
with total balances of $3.4 billion,
which represents 7.2 percent
year-over-year asset growth, driven
by continued growth in originations.
Portfolio performance during 2013
was exceptional with the leasing
and equipment finance provision for
credit losses at .03 percent of average
earning assets.
The leasing and equipment finance
businesses consider investment in
information technology to be a
strategic differentiator. As such, the
businesses implemented a number of
system enhancements throughout the
year. For example, TCF Equipment
Finance received a 2013 Equipment
Leasing and Finance Association
Operations and Technology Excellence
Award for its development and
implementation of its “End of Lease
Cycle” system which provides dynamic
workflow processes for all lease end
of term activity. TCF’s leasing and
equipment finance businesses
represent the 30th largest equipment
finance/leasing company in the U.S.
and the 15th largest bank-affiliated
leasing company.
Consumer real estate loans decreased
5 percent during the year to $6.3 billion.
Given the reduction in borrowers
meeting TCF’s underwriting criteria
and the competition for those that
do, TCF’s focus in the consumer real
estate portfolio has been on high-
quality junior liens originated on a
national level. These loans are made
to high-FICO borrowers which has
resulted in pristine credit quality
within the portfolio. TCF has been
actively managing the concentration
risk in this portfolio by selling a
portion of the originations on a
quarterly basis. TCF’s home equity
line of credit portfolio totaled
$2.3 billion at December 31, 2013 with
only 10.2 percent reaching maturity
or draw period end prior to 2021.
With increased competition in our
banking footprint, commercial loan
balances declined 7.5 percent during
the year to $3.1 billion. We continued
to see strong originations in 2013 of
$1.6 billion; however, competition in
the marketplace has led to elevated
levels of prepayments. While TCF
has focused on maintaining strong
relationships with our current
customers, the growth opportunities
in our national lending businesses
have given us the luxury of selectively
choosing commercial loans based on
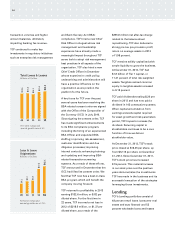
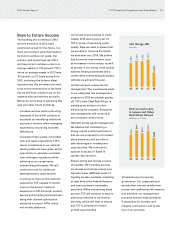
Total Deposits
Billions of Dollars
1312111009
$14.4
$11.6
$11.6
$12.2
$14.1
1312111009
1.07%
0.53%
0.38%
0.31%
0.26%
Total Deposits
Average Interest Rate on Deposits
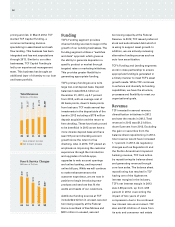
Tangible Realized
Common Equity
Millions of Dollars
Tangible Realized Common Equity
Tangible Realized Common Equity Ratio
1312111009
$1,485
$1,020
$1,334
$1,579
$1,353
1312111009
5.75%
7.28%
8.42%
7.52%
8.18%
2013 Annual Report // TCF Financial Corporation and Subsidiaries 07