TCF Bank 2013 Annual Report Download - page 11
Download and view the complete annual report
Please find page 11 of the 2013 TCF Bank annual report below. You can navigate through the pages in the report by either clicking on the pages listed below, or by using the keyword search tool below to find specific information within the annual report.-
 1
1 -
 2
2 -
 3
3 -
 4
4 -
 5
5 -
 6
6 -
 7
7 -
 8
8 -
 9
9 -
 10
10 -
 11
11 -
 12
12 -
 13
13 -
 14
14 -
 15
15 -
 16
16 -
 17
17 -
 18
18 -
 19
19 -
 20
20 -
 21
21 -
 22
22 -
23
-
24
-
25
-
26
-
27
-
28
-
29
-
30
-
31
-
32
-
33
-
34
-
35
-
36
-
37
-
38
-
39
-
40
-
41
-
42
-
43
-
44
-
45
-
46
-
47
-
48
-
49
-
50
-
51
-
52
-
53
-
54
-
55
-
56
-
57
-
58
-
59
-
60
-
61
-
62
-
63
-
64
-
65
-
66
-
67
-
68
-
69
-
70
-
71
-
72
-
73
-
74
-
75
-
76
-
77
-
78
-
79
-
80
-
81
-
82
-
83
-
84
-
85
-
86
-
87
-
88
-
89
-
90
-
91
-
92
-
93
-
94
-
95
-
96
-
97
-
98
-
99
-
100
-
101
-
102
-
103
-
104
-
105
-
106
-
107
-
108
-
109
-
110
-
111
-
112
-
113
-
114
-
115
-
116
-
117
-
118
-
119
-
120
-
121
-
122
-
123
-
124
-
125
-
126
-
127
-
128
-
129
-
130
-
131
-
132
-
133
-
134
-
135
-
136
-
137
-
138
-
139
 |
 |

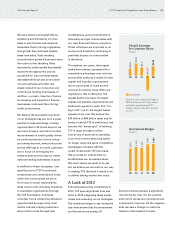
businesses for a pre-tax gain of
$51.4 million in 2013. This was a
revenue source TCF did not have
two years ago.
Banking fees and service charges
totaled $241.2 million in 2013, a
decrease of 5.3 percent year-over-year.
The decline was primarily due to a
change in customer behavior in which
transaction volumes have decreased
and average balances have increased.
This has been partially offset by an
increase in checking accounts due to
decreased attrition as a result of the
return to free checking. Customer
behavior remains an uncertainty
moving forward, but we are confident
that we can continue to grow the
deposit base through our improved
customer experience and new
product and service initiatives.
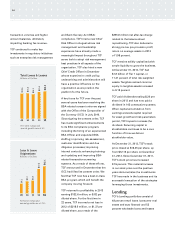
Card revenue in 2013 totaled $51.9
million, a 1.4 percent decrease from
2012, and remains significantly
below historical levels given the
implementation of the Durbin
Amendment in 2011. During 2013, the
Durbin Amendment debate resurfaced
as the Federal Reserve appealed a U.S.
District judge’s ruling that the Federal
Reserve’s original rule did not cap debit
card interchange fees low enough. This
creates further uncertainty surrounding
interchange; however, TCF’s recent
initiatives to diversify its revenue
sources have reduced its reliance on
card revenue. We will keep a close eye
on this issue in 2014.
With these various revenue sources,
along with leasing and equipment
finance revenue which totaled $92
million in 2013, TCF has a much more
diverse revenue base than in past
years and less concentration in any
one area. We will continue to explore
additional revenue opportunities in
2014 and beyond.
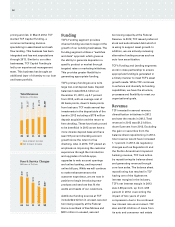
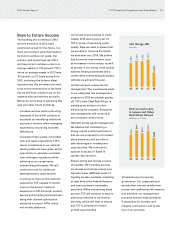
Credit Quality
After seeing positive signs in 2012,
TCF’s credit recovery story really took
hold in 2013. Reduced unemployment
levels, improving home values and
work-outs of problem loans have led
to consistent credit improvements
within our loan and lease portfolio.
Net charge-offs of .81 percent in 2013
declined 73 basis points from 2012 as
home values in our markets showed
steady improvement. As a result,
provision for loan and lease losses in
2013 totaled $118.4 million, a decrease
of 52.2 percent from 2012.
TCF made great strides in reducing its
levels of non-accrual loans and leases
and other real estate owned during the
year. Non-accrual loans and leases
declined 27 percent to $277 million.
The decrease was impacted by a non-
accrual policy change for consumer
real estate loans which resulted in an
additional $48.6 million of loans
moving from over 60-day delinquency
to non-accrual status in the third
quarter of 2013, partially offset
by a $40.5 million sale of non-accrual
loans during the second quarter of
2013. Other real estate owned of
$68.9 million was down 29 percent
from 2012, partially due to a portfolio
sale of 184 consumer properties during
the first quarter of 2013.
Over 60-day delinquencies, the
leading credit indicator for TCF’s
consumer real estate portfolio,
showed significant improvement
during the year with a decrease of
98 basis points to .40 percent. The
decrease was impacted by the
previously mentioned non-accrual
policy change for consumer real
estate loans. The leading credit
indicator on the commercial side,
accruing classified assets, showed
similar improvement with
a decrease of 30.7 percent to
$156.3 million. Meanwhile, TCF’s
national lending businesses continue
to produce superb credit metrics and
meet expectations.
We are pleased with the overall credit
improvement we saw in 2013. TCF’s
credit recovery has taken longer than
many other banks, but has positioned
us as one of the few banks that still
has further credit leverage. Our
Turning the Corner on Credit Quality
“Reduced unemployment levels, improving home values
and work-outs of problem loans have led to consistent
credit improvements within our loan and lease portfolio.”
2013 Annual Report // TCF Financial Corporation and Subsidiaries 09