TCF Bank 2013 Annual Report Download - page 112
Download and view the complete annual report
Please find page 112 of the 2013 TCF Bank annual report below. You can navigate through the pages in the report by either clicking on the pages listed below, or by using the keyword search tool below to find specific information within the annual report.-
 1
1 -
2
-
3
-
4
-
5
-
6
-
7
-
8
-
9
-
10
-
11
-
12
-
13
-
14
-
15
-
16
-
17
-
18
-
19
-
20
-
21
-
22
-
23
-
24
-
25
-
26
-
27
-
28
-
29
-
30
-
31
-
32
-
33
-
34
-
35
-
36
-
37
-
38
-
39
-
40
-
41
-
42
-
43
-
44
-
45
-
46
-
47
-
48
-
49
-
50
-
51
-
52
-
53
-
54
-
55
-
56
-
57
-
58
-
59
-
60
-
61
-
62
-
63
-
64
-
65
-
66
-
67
-
68
-
69
-
70
-
71
-
72
-
73
-
74
-
75
-
76
-
77
-
78
-
79
-
80
-
81
-
82
-
83
-
84
-
85
-
86
-
87
-
88
-
89
-
90
-
91
-
92
-
93
-
94
-
95
-
96
-
97
-
98
-
99
-
100
-
101
-
 102
102 -
 103
103 -
 104
104 -
 105
105 -
 106
106 -
 107
107 -
 108
108 -
 109
109 -
 110
110 -
 111
111 -
 112
112 -
 113
113 -
 114
114 -
 115
115 -
 116
116 -
 117
117 -
 118
118 -
 119
119 -
 120
120 -
 121
121 -
 122
122 -
123
-
124
-
125
-
126
-
127
-
128
-
129
-
130
-
131
-
132
-
133
-
134
-
135
-
136
-
137
-
138
-
139
 |
 |

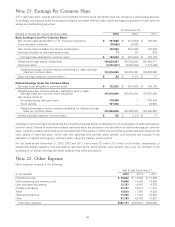
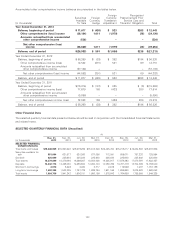
Note 21. Earnings Per Common Share
TCF’s restricted stock awards that pay non-forfeitable common stock dividends meet the criteria of a participating security.
Accordingly, earnings per share is calculated using the two-class method, under which earnings are allocated to both common
shares and participating securities.
At December 31,
(Dollars in thousands, except per-share data) 2013 2012 2011
Basic Earnings (Loss) Per Common Share
Net income (loss) attributable to TCF Financial Corporation $ 151,668 $ (212,884) $ 109,394
Preferred stock dividends (19,065) (5,606) –
Net income (loss) available to common stockholders 132,603 (218,490) 109,394
Earnings allocated to participating securities 71 50 292
Earnings (loss) allocated to common stock $ 132,532 $ (218,540) $ 109,102
Weighted-average shares outstanding 164,229,421 162,288,902 155,938,871
Restricted stock (3,213,417) (3,020,094) (1,716,565)
Weighted-average common shares outstanding for basic earnings
(loss) per common share 161,016,004 159,268,808 154,222,306
Basic earnings (loss) per common share $ .82 $ (1.37) $ .71
Diluted Earnings (Loss) Per Common Share
Earnings (loss) allocated to common stock $ 132,532 $ (218,540) $ 109,102
Weighted-average common shares outstanding used in basic
earnings (loss) per common share calculation 161,016,004 159,268,808 154,222,306
Net dilutive effect of:
Non-participating restricted stock 719,459 – 204,354
Stock options 191,092 – 82,560
Weighted-average common shares outstanding for diluted earnings
(loss) per common share 161,926,555 159,268,808 154,509,220
Diluted earnings (loss) per common share $ .82 $ (1.37) $ .71
All shares of restricted stock are deducted from weighted-average shares outstanding for the computation of basic earnings per
common share. Shares of performance-based restricted stock are included in the calculation of diluted earnings per common
share, using the treasury stock method, at the beginning of the quarter in which the performance goals have been achieved. All
other shares of restricted stock, which vest over specified time periods, stock options, and warrants, are included in the
calculation of diluted earnings per common share, using the treasury stock method.
For the years ended December 31, 2013, 2012 and 2011, there were 3.8 million, 5.1 million and 5 million, respectively, of
outstanding shares related to non-participating restricted stock, stock options, and warrants that were not included in the
computation of diluted earnings per share because they were anti-dilutive.
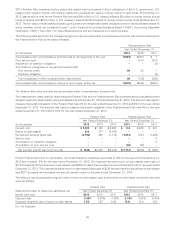
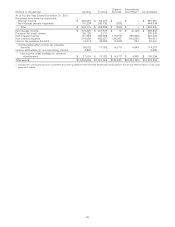
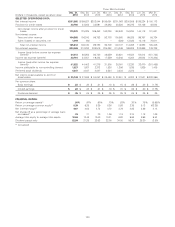
Note 22. Other Expense
Other expense consists of the following.
Year Ended December 31,
(In thousands) 2013 2012 2011
Professional fees $ 18,642 $ 13,608 $ 15,466
Card processing and issuance cost 15,868 15,586 18,593
Loan and lease processing 13,787 9,567 6,533
Outside processing 13,767 12,919 11,910
Travel 12,810 11,740 9,880
Telecommunications 11,720 11,735 12,420
Other 81,183 88,742 70,687
Total other expense $167,777 $163,897 $145,489
96