TCF Bank 2013 Annual Report Download - page 83
Download and view the complete annual report
Please find page 83 of the 2013 TCF Bank annual report below. You can navigate through the pages in the report by either clicking on the pages listed below, or by using the keyword search tool below to find specific information within the annual report.-
 1
1 -
2
-
3
-
4
-
5
-
6
-
7
-
8
-
9
-
10
-
11
-
12
-
13
-
14
-
15
-
16
-
17
-
18
-
19
-
20
-
21
-
22
-
23
-
24
-
25
-
26
-
27
-
28
-
29
-
30
-
31
-
32
-
33
-
34
-
35
-
36
-
37
-
38
-
39
-
40
-
41
-
42
-
43
-
44
-
45
-
46
-
47
-
48
-
49
-
50
-
51
-
52
-
53
-
54
-
55
-
56
-
57
-
58
-
59
-
60
-
61
-
62
-
63
-
64
-
65
-
66
-
67
-
68
-
69
-
70
-
71
-
72
-
 73
73 -
 74
74 -
 75
75 -
 76
76 -
 77
77 -
 78
78 -
 79
79 -
 80
80 -
 81
81 -
 82
82 -
 83
83 -
 84
84 -
 85
85 -
 86
86 -
 87
87 -
 88
88 -
 89
89 -
 90
90 -
 91
91 -
 92
92 -
 93
93 -
94
-
95
-
96
-
97
-
98
-
99
-
100
-
101
-
102
-
103
-
104
-
105
-
106
-
107
-
108
-
109
-
110
-
111
-
112
-
113
-
114
-
115
-
116
-
117
-
118
-
119
-
120
-
121
-
122
-
123
-
124
-
125
-
126
-
127
-
128
-
129
-
130
-
131
-
132
-
133
-
134
-
135
-
136
-
137
-
138
-
139
 |
 |

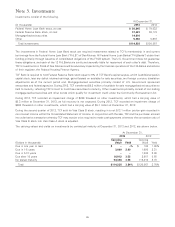
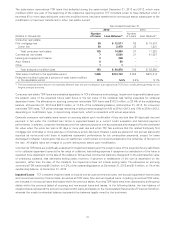
The amortized cost, fair value and yield of securities available for sale by contractual maturity, at December 31, 2013 and 2012,
are shown below. The remaining contractual principal maturities do not consider prepayments. Remaining expected maturities
will differ from contractual maturities because borrowers may have the right to prepay.
At December 31, 2013 At December 31, 2012
Amortized Fair Amortized Fair
(Dollars in thousands) Cost Value Yield Cost Value Yield
Due in 1-5 years $ 138 $ 140 5.24% $ 102 $ 107 9.17%
Due in 5-10 years 24,328 24,543 2.17 114 115 2.63
Due after 10 years 567,910 523,447 2.67 691,481 709,959 2.71
No stated maturity 1,642 2,934 – 1,642 1,910 –
Total $594,018 $551,064 2.65% $693,339 $712,091 2.70%
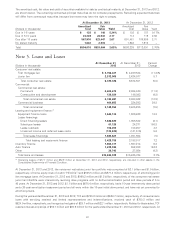
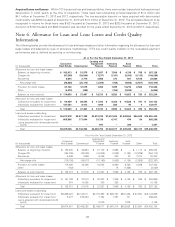
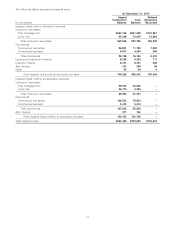
Note 5. Loans and Leases
At December 31, At December 31, Percent
(Dollars in thousands) 2013 2012 Change
Consumer real estate:
First mortgage lien $ 3,766,421 $ 4,239,524 (11.2)%
Junior lien 2,572,905 2,434,977 5.7
Total consumer real estate 6,339,326 6,674,501 (5.0)
Commercial:
Commercial real estate:
Permanent 2,604,673 2,934,849 (11.3)
Construction and development 139,024 146,093 (4.8)
Total commercial real estate 2,743,697 3,080,942 (10.9)
Commercial business 404,655 324,293 24.8
Total commercial 3,148,352 3,405,235 (7.5)
Leasing and equipment finance:(1)
Equipment finance loans 1,546,134 1,306,423 18.3
Lease financings:
Direct financing leases 1,846,829 1,905,532 (3.1)
Sales-type leases 61,125 24,371 150.8
Lease residuals 108,203 103,207 4.8
Unearned income and deferred lease costs (133,536) (141,516) 5.6
Total lease financings 1,882,621 1,891,594 (.5)
Total leasing and equipment finance 3,428,755 3,198,017 7.2
Inventory finance 1,664,377 1,567,214 6.2
Auto finance 1,239,386 552,833 124.2
Other 26,743 27,924 (4.2)
Total loans and leases $15,846,939 $15,425,724 2.7%
(1) Operating leases of $77.7 million and $82.9 million at December 31, 2013 and 2012, respectively, are included in other assets in the
Consolidated Statements of Financial Condition.
At December 31, 2013 and 2012, the consumer real estate junior lien portfolio was comprised of $2.1 billion and $1.9 billion,
respectively, of home equity lines of credit (‘‘HELOCs’’) and $505.5 million and $577.8 million, respectively, of amortizing junior
lien mortgage loans. At December 31, 2013 and 2012, $969.2 million and $1.2 billion, respectively, of the consumer real estate
junior lien HELOCs were interest-only revolving draw programs with no defined amortization period and draw periods of 5 to
40 years. At December 31, 2013 and 2012, $1.1 billion and $675.4 million, respectively, had a 10-year interest-only draw period
and a 20-year amortization repayment period and all were within the 10-year initial draw period, and have not yet converted to
amortizing loans.
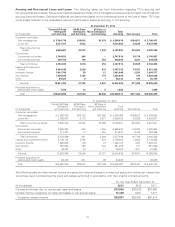
During the years ended December 31, 2013 and 2012, TCF sold $795.3 million and $536.7 million, respectively, of consumer auto
loans with servicing retained and limited representations and indemnifications, received cash of $780.3 million and
$524.9 million, respectively, and recognized net gains of $29.7 million and $22.1 million, respectively. Related to these sales, TCF
retained interest-only strips of $50.7 million and $39.5 million for the years ended December 31, 2013 and 2012, respectively. At
67