TCF Bank 2013 Annual Report Download - page 42
Download and view the complete annual report
Please find page 42 of the 2013 TCF Bank annual report below. You can navigate through the pages in the report by either clicking on the pages listed below, or by using the keyword search tool below to find specific information within the annual report.-
 1
1 -
2
-
3
-
4
-
5
-
6
-
7
-
8
-
9
-
10
-
11
-
12
-
13
-
14
-
15
-
16
-
17
-
18
-
19
-
20
-
21
-
22
-
23
-
24
-
25
-
26
-
27
-
28
-
29
-
30
-
31
-
 32
32 -
 33
33 -
 34
34 -
 35
35 -
 36
36 -
 37
37 -
 38
38 -
 39
39 -
 40
40 -
 41
41 -
 42
42 -
 43
43 -
 44
44 -
 45
45 -
 46
46 -
 47
47 -
 48
48 -
 49
49 -
 50
50 -
 51
51 -
 52
52 -
53
-
54
-
55
-
56
-
57
-
58
-
59
-
60
-
61
-
62
-
63
-
64
-
65
-
66
-
67
-
68
-
69
-
70
-
71
-
72
-
73
-
74
-
75
-
76
-
77
-
78
-
79
-
80
-
81
-
82
-
83
-
84
-
85
-
86
-
87
-
88
-
89
-
90
-
91
-
92
-
93
-
94
-
95
-
96
-
97
-
98
-
99
-
100
-
101
-
102
-
103
-
104
-
105
-
106
-
107
-
108
-
109
-
110
-
111
-
112
-
113
-
114
-
115
-
116
-
117
-
118
-
119
-
120
-
121
-
122
-
123
-
124
-
125
-
126
-
127
-
128
-
129
-
130
-
131
-
132
-
133
-
134
-
135
-
136
-
137
-
138
-
139
 |
 |

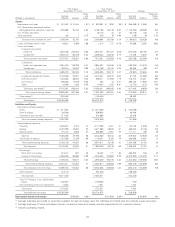
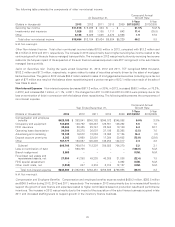
Net interest margin was 4.68%, 4.65% and 3.99% for 2013, 2012 and 2011, respectively. The increase in 2013 was primarily due
to the balance sheet repositioning, partially offset by downward pressure on origination yields in the lending businesses due to
the low interest rate environment as well as a shift in commercial real estate from higher yielding fixed-rate loans to lower
yielding variable-rate loans due to marketplace demand. The increase in 2012 was primarily due to lower average cost of
borrowings due to the effects of the balance sheet repositioning, partially offset by a reduction in interest income on mortgage-
backed securities and rate compression as the leasing and equipment finance and inventory finance portfolios re-priced in the
low rate environment.
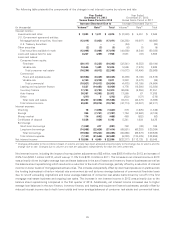
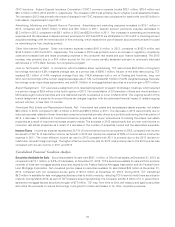
Provision for Credit Losses The provision for credit losses is calculated as part of the determination of the allowance for loan
and lease losses which is a critical accounting estimate. TCF’s methodologies for determining and allocating the allowance for
loan and lease losses and the related provision for credit losses focus on historical trends in net charge-offs, delinquencies in the
loan and lease portfolio, value of collateral, general economic conditions and management’s assessment of credit risk in the
current loan and lease portfolio.
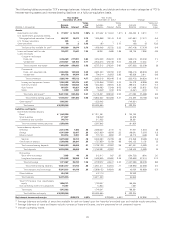
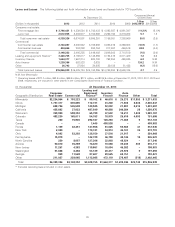
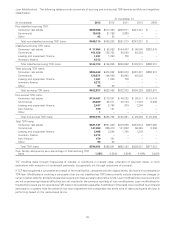
The following table summarizes the composition of TCF’s provision for credit losses for the years ended December 31, 2013,
2012 and 2011.
Year Ended December 31, Change
(Dollars in thousands) 2013 2012 2011 2013/2012 2012/2011
Consumer real estate $ 87,100 73.6% $178,496 72.1% $163,696 81.5% $ (91,396) (51.2)% $14,800 9.0%
Commercial 12,515 10.6 43,498 17.6 25,555 12.7 (30,983) (71.2) 17,943 70.2
Leasing and equipment
finance 1,005 .8 10,054 4.1 7,395 3.7 (9,049) (90.0) 2,659 36.0
Inventory finance 1,949 1.6 6,060 2.4 1,318 .7 (4,111) (67.8) 4,742 N.M.
Auto finance 13,215 11.2 6,726 2.7 – – 6,489 96.5 6,726 N.M.
Other 2,584 2.2 2,609 1.1 2,879 1.4 (25) (1.0) (270) (9.4)
Total $118,368 100.0% $247,443 100.0% $200,843 100.0% $(129,075) (52.2) $46,600 23.2
N.M. Not Meaningful
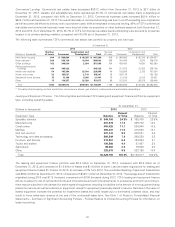
TCF provided $118.4 million for credit losses in 2013, compared with $247.4 million in 2012 and $200.8 million in 2011. The
decrease in provision expense during 2013 was primarily due to decreased net charge-offs in the consumer real estate portfolio
due to improved home values and a reduction in incidents of default, the decreased net charge-offs in the commercial portfolio
due to improved credit quality and continued efforts to actively work out problem loans, and the impact of the clarifying
bankruptcy-related regulatory guidance related to consumer loans adopted in 2012. The increase in provision expense during
2012 was primarily due to $36.9 million related to the impact of clarifying bankruptcy-related regulatory guidance adopted in 2012
(see Consolidated Financial Condition Analysis – Credit Quality for a discussion about the bankruptcy-related guidance), and
increased provision in the commercial portfolio as TCF aggressively addressed non-accrual loans and leases and classified loans.
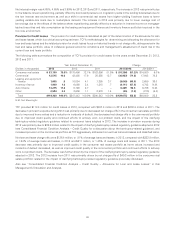
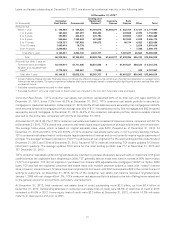
Net loan and lease charge-offs were $126.4 million, or .81% of average loans and leases, in 2013, compared with $233.8 million,
or 1.54% of average loans and leases, in 2012 and $211 million, or 1.45% of average loans and leases, in 2011. The 2013
decrease was primarily due to improved credit quality in the consumer real estate portfolio as home values increased and
incidents of default decreased, as well as improved credit quality in the commercial portfolio and continued efforts to actively
work out problem loans. The decrease was further driven by the impact of the clarifying bankruptcy-related regulatory guidance
adopted in 2012. The 2012 increase from 2011 was primarily driven by net charge-offs of $49.3 million in the consumer real
estate portfolio related to the impact of clarifying bankruptcy-related regulatory guidance previously discussed.
Also see ‘‘Consolidated Financial Condition Analysis – Credit Quality – Allowance for Loan and Lease Losses’’ in this
Management’s Discussion and Analysis.
26