TCF Bank 2013 Annual Report Download - page 119
Download and view the complete annual report
Please find page 119 of the 2013 TCF Bank annual report below. You can navigate through the pages in the report by either clicking on the pages listed below, or by using the keyword search tool below to find specific information within the annual report.-
 1
1 -
2
-
3
-
4
-
5
-
6
-
7
-
8
-
9
-
10
-
11
-
12
-
13
-
14
-
15
-
16
-
17
-
18
-
19
-
20
-
21
-
22
-
23
-
24
-
25
-
26
-
27
-
28
-
29
-
30
-
31
-
32
-
33
-
34
-
35
-
36
-
37
-
38
-
39
-
40
-
41
-
42
-
43
-
44
-
45
-
46
-
47
-
48
-
49
-
50
-
51
-
52
-
53
-
54
-
55
-
56
-
57
-
58
-
59
-
60
-
61
-
62
-
63
-
64
-
65
-
66
-
67
-
68
-
69
-
70
-
71
-
72
-
73
-
74
-
75
-
76
-
77
-
78
-
79
-
80
-
81
-
82
-
83
-
84
-
85
-
86
-
87
-
88
-
89
-
90
-
91
-
92
-
93
-
94
-
95
-
96
-
97
-
98
-
99
-
100
-
101
-
102
-
103
-
104
-
105
-
106
-
107
-
108
-
 109
109 -
 110
110 -
 111
111 -
 112
112 -
 113
113 -
 114
114 -
 115
115 -
 116
116 -
 117
117 -
 118
118 -
 119
119 -
 120
120 -
 121
121 -
 122
122 -
 123
123 -
 124
124 -
 125
125 -
 126
126 -
 127
127 -
 128
128 -
 129
129 -
130
-
131
-
132
-
133
-
134
-
135
-
136
-
137
-
138
-
139
 |
 |

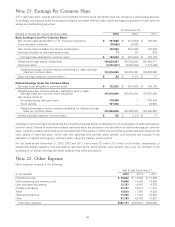
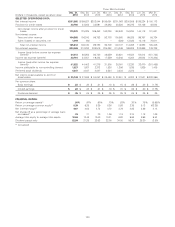
Three Months Ended
Dec. 31, Sep. 30, Jun. 30, Mar. 31, Dec. 31, Sep. 30, Jun. 30, Mar. 31,
(Dollars in thousands, except per-share data) 2013 2013 2013 2013 2012 2012 2012 2012
SELECTED OPERATIONS DATA:
Net interest income $201,862 $199,627 $202,044 $199,091 $201,063 $200,559 $198,224 $ 180,173
Provision for credit losses 22,792 24,602 32,591 38,383 48,520 96,275 54,106 48,542
Net interest income after provision for credit
losses 179,070 175,025 169,453 160,708 152,543 104,284 144,118 131,631
Non-interest income:
Fees and other revenue 104,368 106,240 99,783 92,703 100,665 99,025 99,767 88,734
Gains (losses) on securities, net 1,044 (80) – – (528) 13,033 13,116 76,611
Total non-interest income 105,412 106,160 99,783 92,703 100,137 112,058 112,883 165,345
Non-interest expense 220,469 212,232 208,516 204,052 214,049 196,808 202,989 748,708
Income (loss) before income tax expense
(benefit) 64,013 68,953 60,720 49,359 38,631 19,534 54,012 (451,732)
Income tax expense (benefit) 22,791 24,551 19,444 17,559 10,540 6,304 20,542 (170,244)
Income (loss) after income tax expense
(benefit) 41,222 44,402 41,276 31,800 28,091 13,230 33,470 (281,488)
Income attributable to non-controlling interest 1,227 1,607 2,372 1,826 1,306 1,536 1,939 1,406
Preferred stock dividends 4,847 4,847 4,847 4,524 3,234 2,372 – –
Net income (loss) available to common
stockholders $ 35,148 $ 37,948 $ 34,057 $ 25,450 $ 23,551 $ 9,322 $ 31,531 $(282,894)
Per common share:
Basic earnings $ .22 $ .24 $ .21 $ .16 $ .15 $ .06 $ .20 $ (1.78)
Diluted earnings $ .22 $ .23 $ .21 $ .16 $ .15 $ .06 $ .20 $ (1.78)
Dividends declared $ .05 $ .05 $ .05 $ .05 $ .05 $ .05 $ .05 $ .05
FINANCIAL RATIOS:
Return on average assets(1) .90% .97% .90% .70% .63% .30% .76% (5.96)%
Return on average common equity(1) 8.39 9.28 8.39 6.36 5.93 2.36 8.13 (63.38)
Net interest margin(1) 4.67 4.62 4.72 4.72 4.79 4.85 4.86 4.14
Net charge-off as a percentage of average loans
and leases(1) .76 .71 .70 1.06 1.18 2.74 1.18 1.06
Average total equity to average total assets 10.66 10.46 10.40 10.31 9.92 9.96 8.96 9.52
Dividend payout ratio 22.99 21.25 23.63 32.00 34.00 85.70 25.30 (2.80)
(1) Annualized
103