TCF Bank 2013 Annual Report Download - page 72
Download and view the complete annual report
Please find page 72 of the 2013 TCF Bank annual report below. You can navigate through the pages in the report by either clicking on the pages listed below, or by using the keyword search tool below to find specific information within the annual report.-
 1
1 -
2
-
3
-
4
-
5
-
6
-
7
-
8
-
9
-
10
-
11
-
12
-
13
-
14
-
15
-
16
-
17
-
18
-
19
-
20
-
21
-
22
-
23
-
24
-
25
-
26
-
27
-
28
-
29
-
30
-
31
-
32
-
33
-
34
-
35
-
36
-
37
-
38
-
39
-
40
-
41
-
42
-
43
-
44
-
45
-
46
-
47
-
48
-
49
-
50
-
51
-
52
-
53
-
54
-
55
-
56
-
57
-
58
-
59
-
60
-
61
-
 62
62 -
 63
63 -
 64
64 -
 65
65 -
 66
66 -
 67
67 -
 68
68 -
 69
69 -
 70
70 -
 71
71 -
 72
72 -
 73
73 -
 74
74 -
 75
75 -
 76
76 -
 77
77 -
 78
78 -
 79
79 -
 80
80 -
 81
81 -
 82
82 -
83
-
84
-
85
-
86
-
87
-
88
-
89
-
90
-
91
-
92
-
93
-
94
-
95
-
96
-
97
-
98
-
99
-
100
-
101
-
102
-
103
-
104
-
105
-
106
-
107
-
108
-
109
-
110
-
111
-
112
-
113
-
114
-
115
-
116
-
117
-
118
-
119
-
120
-
121
-
122
-
123
-
124
-
125
-
126
-
127
-
128
-
129
-
130
-
131
-
132
-
133
-
134
-
135
-
136
-
137
-
138
-
139
 |
 |

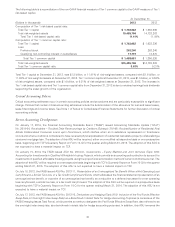
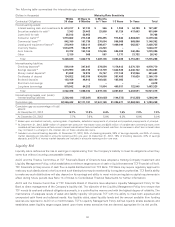
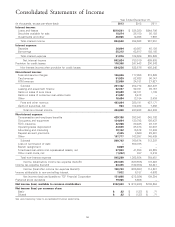
Consolidated Statements of Income
Year Ended December 31,
(In thousands, except per-share data) 2013 2012 2011
Interest income:
Loans and leases $819,501 $ 835,380 $844,796
Securities available for sale 18,074 35,150 85,188
Investments and other 26,965 14,093 7,967
Total interest income 864,540 884,623 937,951
Interest expense:
Deposits 36,604 40,987 45,108
Borrowings 25,312 63,617 193,155
Total interest expense 61,916 104,604 238,263
Net interest income 802,624 780,019 699,688
Provision for credit losses 118,368 247,443 200,843
Net interest income after provision for credit losses 684,256 532,576 498,845
Non-interest income:
Fees and service charges 166,606 177,953 219,363
Card revenue 51,920 52,638 96,147
ATM revenue 22,656 24,181 27,927
Subtotal 241,182 254,772 343,437
Leasing and equipment finance 92,037 92,721 89,167
Gains on sales of auto loans 29,699 22,101 1,133
Gains on sales of consumer real estate loans 21,692 5,413 –
Other 18,484 13,184 3,434
Fees and other revenue 403,094 388,191 437,171
Gains on securities, net 964 102,232 7,263
Total non-interest income 404,058 490,423 444,434
Non-interest expense:
Compensation and employee benefits 429,188 393,841 348,792
Occupancy and equipment 134,694 130,792 126,437
FDIC insurance 32,066 30,425 28,747
Operating lease depreciation 24,500 25,378 30,007
Advertising and marketing 19,132 16,572 10,034
Deposit account premiums 2,345 8,669 22,891
Other 167,777 163,897 145,489
Subtotal 809,702 769,574 712,397
Loss on termination of debt –550,735 –
Branch realignment 8,869 ––
Foreclosed real estate and repossessed assets, net 27,950 41,358 49,238
Other credit costs, net (1,252) 887 2,816
Total non-interest expense 845,269 1,362,554 764,451
Income (loss) before income tax expense (benefit) 243,045 (339,555) 178,828
Income tax expense (benefit) 84,345 (132,858) 64,441
Income (loss) after income tax expense (benefit) 158,700 (206,697) 114,387
Income attributable to non-controlling interest 7,032 6,187 4,993
Net income (loss) attributable to TCF Financial Corporation 151,668 (212,884) 109,394
Preferred stock dividends 19,065 5,606 –
Net income (loss) available to common stockholders $132,603 $ (218,490) $109,394
Net income (loss) per common share:
Basic $ .82 $ (1.37) $ .71
Diluted $ .82 $ (1.37) $ .71
See accompanying notes to consolidated financial statements.
56