TCF Bank 2013 Annual Report Download - page 40
Download and view the complete annual report
Please find page 40 of the 2013 TCF Bank annual report below. You can navigate through the pages in the report by either clicking on the pages listed below, or by using the keyword search tool below to find specific information within the annual report.-
 1
1 -
2
-
3
-
4
-
5
-
6
-
7
-
8
-
9
-
10
-
11
-
12
-
13
-
14
-
15
-
16
-
17
-
18
-
19
-
20
-
21
-
22
-
23
-
24
-
25
-
26
-
27
-
28
-
29
-
 30
30 -
 31
31 -
 32
32 -
 33
33 -
 34
34 -
 35
35 -
 36
36 -
 37
37 -
 38
38 -
 39
39 -
 40
40 -
 41
41 -
 42
42 -
 43
43 -
 44
44 -
 45
45 -
 46
46 -
 47
47 -
 48
48 -
 49
49 -
 50
50 -
51
-
52
-
53
-
54
-
55
-
56
-
57
-
58
-
59
-
60
-
61
-
62
-
63
-
64
-
65
-
66
-
67
-
68
-
69
-
70
-
71
-
72
-
73
-
74
-
75
-
76
-
77
-
78
-
79
-
80
-
81
-
82
-
83
-
84
-
85
-
86
-
87
-
88
-
89
-
90
-
91
-
92
-
93
-
94
-
95
-
96
-
97
-
98
-
99
-
100
-
101
-
102
-
103
-
104
-
105
-
106
-
107
-
108
-
109
-
110
-
111
-
112
-
113
-
114
-
115
-
116
-
117
-
118
-
119
-
120
-
121
-
122
-
123
-
124
-
125
-
126
-
127
-
128
-
129
-
130
-
131
-
132
-
133
-
134
-
135
-
136
-
137
-
138
-
139
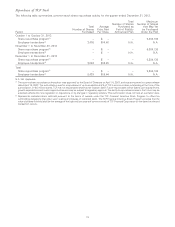
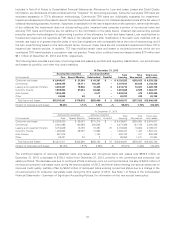
 |
 |
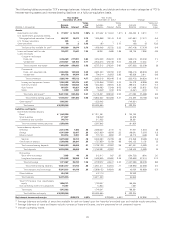
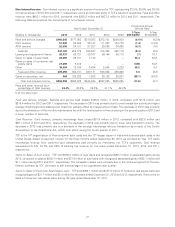
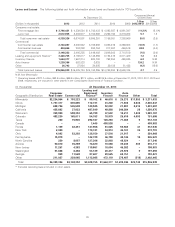
Year Ended Year Ended
December 31, 2012 December 31, 2011 Change
Yields Yields Yields and
Average and Average and Average Rates
(Dollars in thousands) Balance Interest Rates Balance Interest Rates Balance Interest (bps)
Assets:
Investments and other $ 574,422 $ 10,404 1.81% $ 820,981 $ 7,836 .95% $ (246,559) $ 2,568 86
U.S. Government sponsored entities:
Mortgage-backed securities, fixed rate 1,055,868 35,143 3.33 2,198,188 85,138 3.87 (1,142,320) (49,995) (54)
U.S. Treasury securities – – – 48,178 34 .07 (48,178) (34) (7)
Other securities 180 7 3.70 329 16 4.86 (149) (9) (116)
Total securities available for sale(1) 1,056,048 35,150 3.33 2,246,695 85,188 3.79 (1,190,647) (50,038) (46)
Loans and leases held for sale 46,201 3,689 7.98 1,215 131 10.78 44,986 3,558 (280)
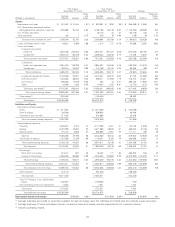
Loans and leases:
Consumer real estate:
Fixed-rate 4,254,039 252,233 5.93 4,627,047 281,427 6.08 (373,008) (29,194) (15)
Variable-rate 2,503,473 126,158 5.04 2,386,234 122,532 5.13 117,239 3,626 (9)
Total consumer real estate 6,757,512 378,391 5.60 7,013,281 403,959 5.76 (255,769) (25,568) (16)
Commercial:
Fixed- and adjustable-rate 2,691,004 149,793 5.57 2,854,327 164,368 5.76 (163,323) (14,575) (19)
Variable-rate 794,214 30,653 3.86 710,758 30,742 4.33 83,456 (89) (47)
Total commercial 3,485,218 180,446 5.18 3,565,085 195,110 5.47 (79,867) (14,664) (29)
Leasing and equipment finance 3,155,946 170,991 5.42 3,074,207 184,575 6.00 81,739 (13,584) (58)
Inventory finance 1,434,643 88,934 6.20 856,271 61,583 7.19 578,372 27,351 (99)
Auto finance 296,083 17,949 6.06 363 13 3.31 295,720 17,936 275
Other 16,549 1,332 8.05 19,324 1,702 8.81 (2,775) (370) (76)
Total loans and leases(2) 15,145,951 838,043 5.53 14,528,531 846,942 5.83 617,420 (8,899) (30)
Total interest-earning assets 16,822,622 887,286 5.27 17,597,422 940,097 5.34 (774,800) (52,811) (7)
Other assets(3) 1,233,042 1,194,550 38,492
Total assets $18,055,664 $18,791,972 $ (736,308)
Liabilities and Equity:
Non-interest bearing deposits:
Retail $ 1,311,561 $ 1,414,659 $ (103,098)
Small business 738,949 698,903 40,046
Commercial and custodial 317,432 291,986 25,446
Total non-interest bearing deposits 2,367,942 2,405,548 (37,606)
Interest-bearing deposits:
Checking 2,256,237 3,105 .14 2,114,098 4,451 .21 142,139 (1,346) (7)
Savings 6,037,939 19,834 .33 5,671,889 28,942 .51 366,050 (9,108) (18)
Money market 770,104 2,859 .37 658,693 2,951 .45 111,411 (92) (8)
Subtotal 9,064,280 25,798 .28 8,444,680 36,344 .43 619,600 (10,546) (15)
Certificates of deposit 1,727,859 15,189 .88 1,103,231 8,764 .79 624,628 6,425 9
Total interest-bearing deposits 10,792,139 40,987 .38 9,547,911 45,108 .47 1,244,228 (4,121) (9)
Total deposits 13,160,081 40,987 .31 11,953,459 45,108 .38 1,206,622 (4,121) (7)
Borrowings:
Short-term borrowings 312,417 937 .30 49,442 171 .35 262,975 766 (5)
Long-term borrowings 2,426,655 62,680 2.58 4,500,564 192,984 4.29 (2,073,909) (130,304) (171)
Total borrowings 2,739,072 63,617 2.32 4,550,006 193,155 4.24 (1,810,934) (129,538) (192)
Total interest-bearing liabilities 13,531,211 104,604 .77 14,097,917 238,263 1.69 (566,706) (133,659) (92)
Total deposits and borrowings 15,899,153 104,604 .66 16,503,465 238,263 1.44 (604,312) (133,659) (78)
Other liabilities 412,170 551,206 (139,036)
Total liabilities 16,311,323 17,054,671 (743,348)
Total TCF Financial Corp. stockholders’
equity 1,729,537 1,729,660 (123)
Non-controlling interest in subsidiaries 14,804 7,641 7,163
Total equity 1,744,341 1,737,301 7,040
Total liabilities and equity $18,055,664 $18,791,972 $ (736,308)
Net interest income and margin $782,682 4.65% $701,834 3.99% $ 80,848 66
(1) Average balances and yields of securities available for sale are based upon the historical amortized cost and exclude equity securities.
(2) Average balances of loans and leases include non-accrual loans and leases, and are presented net of unearned income.
(3) Includes operating leases.
24