TCF Bank 2013 Annual Report Download - page 118
Download and view the complete annual report
Please find page 118 of the 2013 TCF Bank annual report below. You can navigate through the pages in the report by either clicking on the pages listed below, or by using the keyword search tool below to find specific information within the annual report.-
 1
1 -
2
-
3
-
4
-
5
-
6
-
7
-
8
-
9
-
10
-
11
-
12
-
13
-
14
-
15
-
16
-
17
-
18
-
19
-
20
-
21
-
22
-
23
-
24
-
25
-
26
-
27
-
28
-
29
-
30
-
31
-
32
-
33
-
34
-
35
-
36
-
37
-
38
-
39
-
40
-
41
-
42
-
43
-
44
-
45
-
46
-
47
-
48
-
49
-
50
-
51
-
52
-
53
-
54
-
55
-
56
-
57
-
58
-
59
-
60
-
61
-
62
-
63
-
64
-
65
-
66
-
67
-
68
-
69
-
70
-
71
-
72
-
73
-
74
-
75
-
76
-
77
-
78
-
79
-
80
-
81
-
82
-
83
-
84
-
85
-
86
-
87
-
88
-
89
-
90
-
91
-
92
-
93
-
94
-
95
-
96
-
97
-
98
-
99
-
100
-
101
-
102
-
103
-
104
-
105
-
106
-
107
-
 108
108 -
 109
109 -
 110
110 -
 111
111 -
 112
112 -
 113
113 -
 114
114 -
 115
115 -
 116
116 -
 117
117 -
 118
118 -
 119
119 -
 120
120 -
 121
121 -
 122
122 -
 123
123 -
 124
124 -
 125
125 -
 126
126 -
 127
127 -
 128
128 -
129
-
130
-
131
-
132
-
133
-
134
-
135
-
136
-
137
-
138
-
139
 |
 |

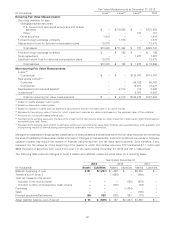
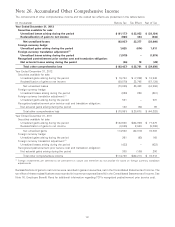
Accumulated other comprehensive income balances are presented in the tables below.
Foreign Recognized
Securities Foreign Currency Postretirement Prior
Available Currency Translation Service Cost and
(In thousands) for Sale Hedge Adjustment Transition Obligation Total
Year Ended December 31, 2013
Balance, beginning of period $ 11,677 $ (420) $ 923 $263 $ 12,443
Other comprehensive (loss) income (38,124) 1,011 (1,979) (28) (39,120)
Amounts reclassified from accumulated
other comprehensive income (536) – – – (536)
Net other comprehensive (loss)
income (38,660) 1,011 (1,979) (28) (39,656)
Balance, end of period $(26,983) $ 591 $(1,056) $235 $(27,213)
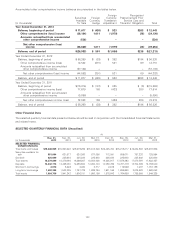
Year Ended December 31, 2012
Balance, beginning of period $ 56,269 $ (29) $ 392 $194 $ 56,826
Other comprehensive income (loss) 12,542 (391) 531 69 12,751
Amounts reclassified from accumulated
other comprehensive income (57,134) – – – (57,134)
Net other comprehensive (loss) income (44,592) (391) 531 69 (44,383)
Balance, end of period $ 11,677 $ (420) $ 923 $263 $ 12,443
Year Ended December 31, 2011
Balance, beginning of period $(16,314) $ (197) $ 825 $ (6) $(15,692)
Other comprehensive income (loss) 77,679 168 (433) 200 77,614
Amounts reclassified from accumulated
other comprehensive income (5,096) – – – (5,096)
Net other comprehensive income (loss) 72,583 168 (433) 200 72,518
Balance, end of period $ 56,269 $ (29) $ 392 $194 $ 56,826
Other Financial Data
The selected quarterly financial data presented below should be read in conjunction with the Consolidated Financial Statements
and related notes.
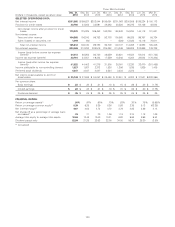
SELECTED QUARTERLY FINANCIAL DATA (Unaudited)
At
Dec. 31, Sep. 30, Jun. 30, Mar. 31, Dec. 31, Sep. 30, Jun. 30, Mar. 31,
(In thousands) 2013 2013 2013 2013 2012 2012 2012 2012
SELECTED FINANCIAL
CONDITION DATA:
Total loans and leases $15,846,939 $15,651,648 $15,579,292 $15,613,346 $15,425,724 $15,218,217 $15,234,504 $15,207,936
Securities available for
sale 551,064 631,677 620,260 677,088 712,091 559,671 757,233 728,894
Goodwill 225,640 225,640 225,640 225,640 225,640 225,640 225,640 225,640
Total assets 18,379,840 18,370,088 18,399,607 18,504,026 18,225,917 17,878,393 17,870,597 17,833,457
Deposits 14,432,776 14,425,030 14,285,584 14,300,104 14,050,786 13,721,419 13,704,306 12,759,040
Short-term borrowings 4,918 8,249 3,030 3,717 2,619 115,529 7,487 1,157,189
Long-term borrowings 1,483,325 1,523,235 1,787,728 1,926,794 1,931,196 1,936,988 2,075,923 1,962,053
Total equity 1,964,759 1,941,243 1,906,181 1,900,159 1,876,643 1,764,669 1,755,908 1,549,325
102