TCF Bank 2013 Annual Report Download - page 49
Download and view the complete annual report
Please find page 49 of the 2013 TCF Bank annual report below. You can navigate through the pages in the report by either clicking on the pages listed below, or by using the keyword search tool below to find specific information within the annual report.-
 1
1 -
2
-
3
-
4
-
5
-
6
-
7
-
8
-
9
-
10
-
11
-
12
-
13
-
14
-
15
-
16
-
17
-
18
-
19
-
20
-
21
-
22
-
23
-
24
-
25
-
26
-
27
-
28
-
29
-
30
-
31
-
32
-
33
-
34
-
35
-
36
-
37
-
38
-
 39
39 -
 40
40 -
 41
41 -
 42
42 -
 43
43 -
 44
44 -
 45
45 -
 46
46 -
 47
47 -
 48
48 -
 49
49 -
 50
50 -
 51
51 -
 52
52 -
 53
53 -
 54
54 -
 55
55 -
 56
56 -
 57
57 -
 58
58 -
 59
59 -
60
-
61
-
62
-
63
-
64
-
65
-
66
-
67
-
68
-
69
-
70
-
71
-
72
-
73
-
74
-
75
-
76
-
77
-
78
-
79
-
80
-
81
-
82
-
83
-
84
-
85
-
86
-
87
-
88
-
89
-
90
-
91
-
92
-
93
-
94
-
95
-
96
-
97
-
98
-
99
-
100
-
101
-
102
-
103
-
104
-
105
-
106
-
107
-
108
-
109
-
110
-
111
-
112
-
113
-
114
-
115
-
116
-
117
-
118
-
119
-
120
-
121
-
122
-
123
-
124
-
125
-
126
-
127
-
128
-
129
-
130
-
131
-
132
-
133
-
134
-
135
-
136
-
137
-
138
-
139
 |
 |
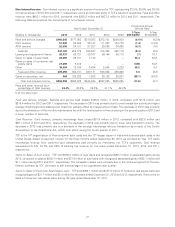
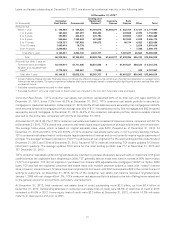
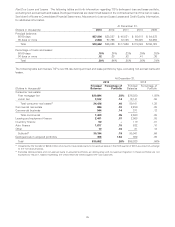
At December 31, 2013 and 2012, $68.5 million and $63.9 million, respectively, of TCF’s lease portfolio was discounted with third-
party financial institutions on a non-recourse basis, which is recorded in long-term borrowings. The leasing and equipment
finance portfolio tables above present lease residuals including lease residuals related to non-recourse debt. Lease residuals
represent the estimated fair value of the leased equipment at the expiration of the initial term of the transaction and are reviewed
on an ongoing basis. Any downward revisions in estimated fair value are recorded to expense in the periods in which they
become known. At December 31, 2013, lease residuals totaled $108.2 million, or 9.07% of original equipment value, including
$15.2 million related to non-recourse sales, compared with $118 million, or 9.74% of original equipment value, including
$14.8 million related to non-recourse sales at December 31, 2012.
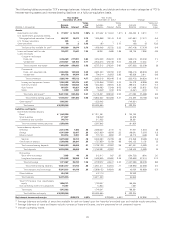
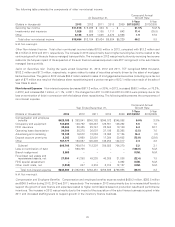
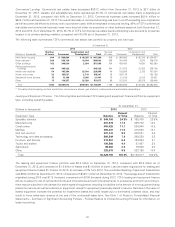
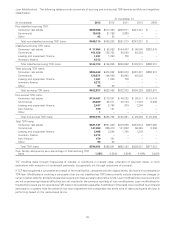
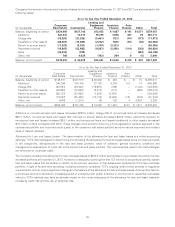
TCF Inventory Finance The following table summarizes TCF’s inventory finance portfolio by marketing segment.
At December 31,
(Dollars in thousands) 2013 2012
Percent Percent
Marketing Segment Balance of Total Balance of Total
Powersports $ 929,111 55.8% $ 943,704 60.2%
Lawn and garden 298,415 18.0 339,224 21.7
Electronics and appliances 57,264 3.4 50,394 3.2
Other 379,587 22.8 233,892 14.9
Total $1,664,377 100.0% $1,567,214 100.0%
Inventory finance continued to expand its core programs during 2013, with an increase in the total portfolio to $1.7 billion, or
10.5% of total loans and leases, at December 31, 2013, compared with $1.6 billion, or 10.2% at December 31, 2012. The
increase was primarily due to continued growth in new dealer relationships within the other industries segment. Inventory
finance originations decreased to $5.1 billion in 2013 compared to $5.2 billion in 2012.
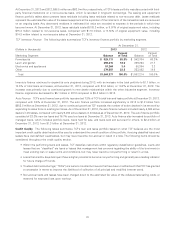
Auto Finance TCF’s auto finance loan portfolio represented 7.8% of TCF’s total loan and lease portfolio at December 31, 2013,
compared with 3.6% at December 31, 2012. The auto finance portfolio increased significantly in 2013 to $1.2 billion from
$552.8 million at December 31, 2012, due to continued growth as TCF expands the number of active dealers in its network by
expanding its sales force in existing territories. As of December 31, 2013, the auto finance network included nearly 8,500 active
dealers in 45 states, compared with nearly 6,200 active dealers in 43 states as of December 31, 2012. The auto finance portfolio
consisted of 23.3% new car loans and 76.7% used car loans at December 31, 2013. Auto finance also increased its portfolio of
managed loans, which includes portfolio loans, loans held for sale, and loans sold and serviced for others, to $2.4 billion at
December 31, 2013, from $1.3 billion at December 31, 2012.
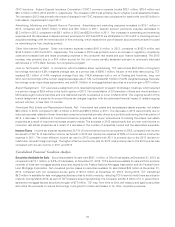
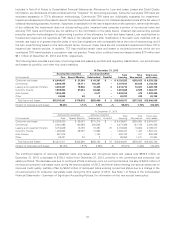
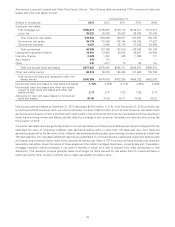
Credit Quality The following tables summarize TCF’s loan and lease portfolio based on what TCF believes are the most
important credit quality data that should be used to understand the overall condition of the portfolio. Accruing classified loans and
leases have well-defined weaknesses, but may never become non-accrual or result in a loss. The following items should be
considered throughout the credit quality section.
• Within the performing loans and leases, TCF classifies customers within regulatory classification guidelines. Loans and
leases that are ‘‘classified’’ are loans or leases that management has concerns regarding the ability of the borrowers to
meet existing loan or lease terms and conditions, but may never become non-performing or result in a loss.
• Loans that are 60+ days delinquent have a higher potential to become non-performing and generally are a leading indicator
for future charge-off trends.
• Troubled debt restructurings (‘‘TDRs’’) are loans to troubled borrowers that have been modified such that TCF has granted
a concession in terms to improve the likelihood of collection of all principal and modified interest owed.
• Non-accrual loans and leases have been charged down to the estimated fair value of the collateral less selling costs, or
reserved for expected loss upon workout.
33