TCF Bank 2013 Annual Report Download - page 51
Download and view the complete annual report
Please find page 51 of the 2013 TCF Bank annual report below. You can navigate through the pages in the report by either clicking on the pages listed below, or by using the keyword search tool below to find specific information within the annual report.-
 1
1 -
2
-
3
-
4
-
5
-
6
-
7
-
8
-
9
-
10
-
11
-
12
-
13
-
14
-
15
-
16
-
17
-
18
-
19
-
20
-
21
-
22
-
23
-
24
-
25
-
26
-
27
-
28
-
29
-
30
-
31
-
32
-
33
-
34
-
35
-
36
-
37
-
38
-
39
-
40
-
 41
41 -
 42
42 -
 43
43 -
 44
44 -
 45
45 -
 46
46 -
 47
47 -
 48
48 -
 49
49 -
 50
50 -
 51
51 -
 52
52 -
 53
53 -
 54
54 -
 55
55 -
 56
56 -
 57
57 -
 58
58 -
 59
59 -
 60
60 -
 61
61 -
62
-
63
-
64
-
65
-
66
-
67
-
68
-
69
-
70
-
71
-
72
-
73
-
74
-
75
-
76
-
77
-
78
-
79
-
80
-
81
-
82
-
83
-
84
-
85
-
86
-
87
-
88
-
89
-
90
-
91
-
92
-
93
-
94
-
95
-
96
-
97
-
98
-
99
-
100
-
101
-
102
-
103
-
104
-
105
-
106
-
107
-
108
-
109
-
110
-
111
-
112
-
113
-
114
-
115
-
116
-
117
-
118
-
119
-
120
-
121
-
122
-
123
-
124
-
125
-
126
-
127
-
128
-
129
-
130
-
131
-
132
-
133
-
134
-
135
-
136
-
137
-
138
-
139
 |
 |

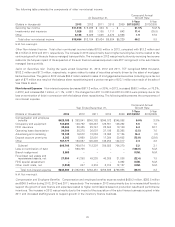
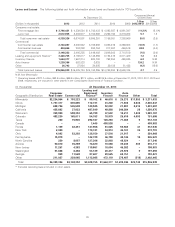
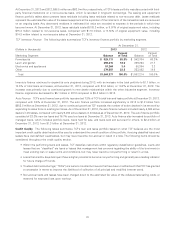
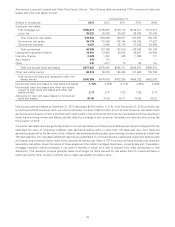
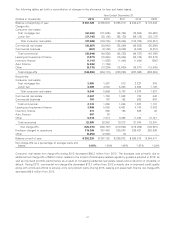
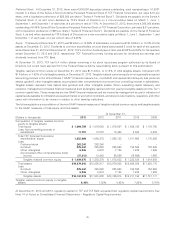
Past Due Loans and Leases The following tables set forth information regarding TCF’s delinquent loan and lease portfolio,
excluding non-accrual loans and leases. Delinquent balances are determined based on the contractual terms of the loan or lease.
See Note 6 of Notes to Consolidated Financial Statements, Allowance for Loan and Lease Losses and Credit Quality Information,
for additional information.
At December 31,
(Dollars in thousands) 2013 2012 2011 2010 2009
Principal balances:
60-89 days $27,806 $38,227 $ 45,531 $ 55,618 $ 54,073
90 days or more 2,846 57,796 72,105 59,425 52,056
Total $30,652 $96,023 $117,636 $115,043 $106,129
Percentage of loans and leases:
60-89 days .18% .26% .33% .39% .38%
90 days or more .02 .38 .52 .41 .36
Total .20% .64% .85% .80% .74%
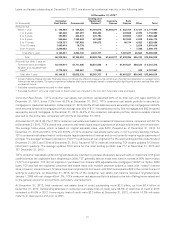
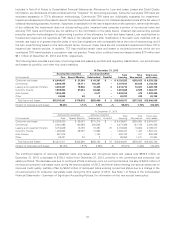
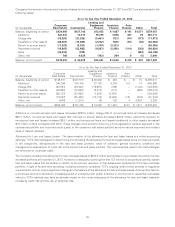
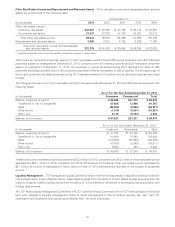
The following table summarizes TCF’s over 60-day delinquent loan and lease portfolio by type, excluding non-accrual loans and
leases.
At December 31,
2013 2012
Principal Percentage of Principal Percentage of
(Dollars in thousands) Balances Portfolio Balances Portfolio
Consumer real estate:
First mortgage lien $20,894 .58% $76,020 1.88%
Junior lien 3,532 .14 13,141 .55
Total consumer real estate(1) 24,426 .40 89,161 1.38
Commercial real estate 886 .03 2,259 .08
Commercial business 544 .14 371 .12
Total commercial 1,430 .05 2,630 .08
Leasing and equipment finance 2,401 .07 2,568 .08
Inventory finance 50 – 119 .01
Auto finance 1,877 .15 532 .10
Other 10 .04 31 .12
Subtotal(2) 30,194 .19 95,041 .64
Delinquencies in acquired portfolios 458 1.64 982 .89
Total $30,652 .20% $96,023 .64%
(1) Impacted by the transfer of $48.6 million of consumer real-estate loans to non-accrual status in the third quarter of 2013 as a result of a change
to the non-accrual policy.
(2) Excludes delinquencies and non-accrual loans in acquired portfolios, as delinquency and non-accrual migration in these portfolios are not
expected to result in losses exceeding the credit reserves netted against the loan balances.
35