TCF Bank 2013 Annual Report Download - page 46
Download and view the complete annual report
Please find page 46 of the 2013 TCF Bank annual report below. You can navigate through the pages in the report by either clicking on the pages listed below, or by using the keyword search tool below to find specific information within the annual report.-
 1
1 -
2
-
3
-
4
-
5
-
6
-
7
-
8
-
9
-
10
-
11
-
12
-
13
-
14
-
15
-
16
-
17
-
18
-
19
-
20
-
21
-
22
-
23
-
24
-
25
-
26
-
27
-
28
-
29
-
30
-
31
-
32
-
33
-
34
-
35
-
 36
36 -
 37
37 -
 38
38 -
 39
39 -
 40
40 -
 41
41 -
 42
42 -
 43
43 -
 44
44 -
 45
45 -
 46
46 -
 47
47 -
 48
48 -
 49
49 -
 50
50 -
 51
51 -
 52
52 -
 53
53 -
 54
54 -
 55
55 -
 56
56 -
57
-
58
-
59
-
60
-
61
-
62
-
63
-
64
-
65
-
66
-
67
-
68
-
69
-
70
-
71
-
72
-
73
-
74
-
75
-
76
-
77
-
78
-
79
-
80
-
81
-
82
-
83
-
84
-
85
-
86
-
87
-
88
-
89
-
90
-
91
-
92
-
93
-
94
-
95
-
96
-
97
-
98
-
99
-
100
-
101
-
102
-
103
-
104
-
105
-
106
-
107
-
108
-
109
-
110
-
111
-
112
-
113
-
114
-
115
-
116
-
117
-
118
-
119
-
120
-
121
-
122
-
123
-
124
-
125
-
126
-
127
-
128
-
129
-
130
-
131
-
132
-
133
-
134
-
135
-
136
-
137
-
138
-
139
 |
 |

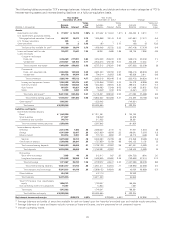
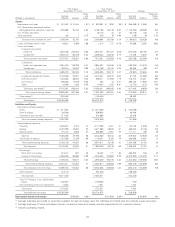
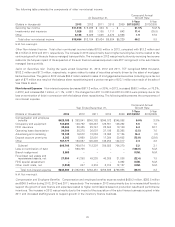
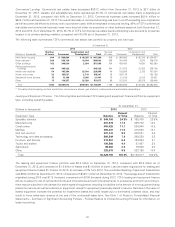
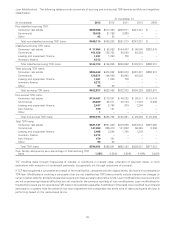
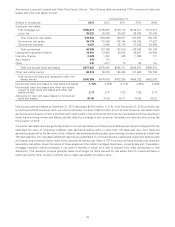
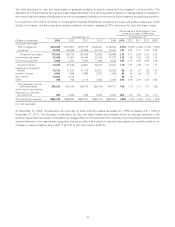
Loans and Leases The following tables set forth information about loans and leases held in TCF’s portfolio.
Compound Annual
At December 31, Growth Rate
1-Year 5-Year
(Dollars in thousands) 2013 2012 2011 2010 2009 2013/2012 2013/2008
Consumer real estate:
First mortgage lien $ 3,766,421 $ 4,239,524 $ 4,742,423 $ 4,893,887 $ 4,961,347 (11.2)% (5.1)%
Junior lien 2,572,905 2,434,977 2,152,868 2,262,194 2,319,222 5.7 1.2
Total consumer real estate 6,339,326 6,674,501 6,895,291 7,156,081 7,280,569 (5.0) (2.8)
Commercial:
Commercial real estate 2,743,697 3,080,942 3,198,698 3,328,216 3,269,003 (10.9) (1.7)
Commercial business 404,655 324,293 250,794 317,987 449,516 24.8 (4.4)
Total commercial 3,148,352 3,405,235 3,449,492 3,646,203 3,718,519 (7.5) (2.0)
Leasing and equipment finance(1) 3,428,755 3,198,017 3,142,259 3,154,478 3,071,429 7.2 6.6
Inventory finance 1,664,377 1,567,214 624,700 792,354 468,805 6.2 N.M
Auto finance 1,239,386 552,833 3,628 – – 124.2 N.M
Other 26,743 27,924 34,885 39,188 51,422 (4.2) (15.6)
Total loans and leases $15,846,939 $15,425,724 $14,150,255 $14,788,304 $14,590,744 2.7 3.5
N.M. Not Meaningful.
(1) Operating leases of $77.7 million, $82.9 million, $69.6 million, $77.4 million, and $105.9 million at December 31, 2013, 2012, 2011, 2010 and
2009, respectively, are included in other assets in the Consolidated Statements of Financial Condition.
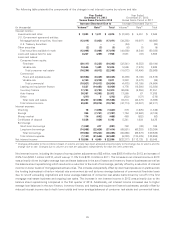
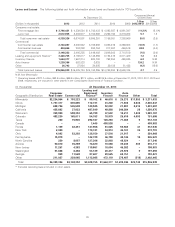
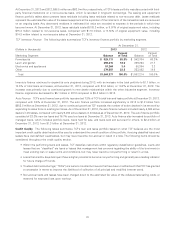
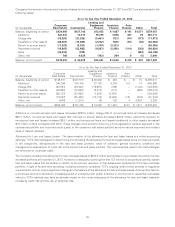
(In thousands) At December 31, 2013
Leasing and
Consumer Equipment Inventory Auto
Geographic Distribution: Real Estate Commercial Finance(1) Finance Finance Other Total
Minnesota $2,234,964 $ 793,223 $ 99,102 $ 46,618 $ 25,273 $11,853 $ 3,211,033
Illinois 1,797,317 600,685 112,731 41,240 71,838 6,636 2,630,447
Michigan 638,736 545,508 140,945 52,002 21,881 2,615 1,401,687
California 435,893 37,023 487,849 49,898 240,284 28 1,250,975
Wisconsin 359,900 598,353 65,789 47,502 10,211 1,432 1,083,187
Colorado 483,230 165,011 54,763 18,979 25,610 4,093 751,686
Texas 220 15,945 292,187 126,263 77,483 5 512,103
Canada – – 1,445 498,538 – – 499,983
Florida 1,139 42,451 147,906 61,025 59,983 41 312,545
New York 2,000 – 170,741 54,913 45,101 36 272,791
Ohio 4,093 53,292 138,150 37,516 21,917 – 254,968
Pennsylvania 15,879 – 142,729 46,759 40,146 10 245,523
North Carolina 220 8,087 127,306 32,903 48,824 – 217,340
Arizona 50,810 35,269 74,420 10,066 39,243 303 210,111
New Jersey 11,261 4,383 119,861 18,094 45,382 – 198,981
Washington 91,668 8,488 53,139 20,417 23,972 9 197,693
Georgia 969 11,569 87,607 29,525 63,751 – 193,421
Other 211,027 229,065 1,112,085 472,119 378,487 (318) 2,402,465
Total $6,339,326 $3,148,352 $3,428,755 $1,664,377 $1,239,386 $26,743 $15,846,939
(1) Excludes operating leases included in other assets.
30