TCF Bank 2013 Annual Report Download - page 75
Download and view the complete annual report
Please find page 75 of the 2013 TCF Bank annual report below. You can navigate through the pages in the report by either clicking on the pages listed below, or by using the keyword search tool below to find specific information within the annual report.-
 1
1 -
2
-
3
-
4
-
5
-
6
-
7
-
8
-
9
-
10
-
11
-
12
-
13
-
14
-
15
-
16
-
17
-
18
-
19
-
20
-
21
-
22
-
23
-
24
-
25
-
26
-
27
-
28
-
29
-
30
-
31
-
32
-
33
-
34
-
35
-
36
-
37
-
38
-
39
-
40
-
41
-
42
-
43
-
44
-
45
-
46
-
47
-
48
-
49
-
50
-
51
-
52
-
53
-
54
-
55
-
56
-
57
-
58
-
59
-
60
-
61
-
62
-
63
-
64
-
 65
65 -
 66
66 -
 67
67 -
 68
68 -
 69
69 -
 70
70 -
 71
71 -
 72
72 -
 73
73 -
 74
74 -
 75
75 -
 76
76 -
 77
77 -
 78
78 -
 79
79 -
 80
80 -
 81
81 -
 82
82 -
 83
83 -
 84
84 -
 85
85 -
86
-
87
-
88
-
89
-
90
-
91
-
92
-
93
-
94
-
95
-
96
-
97
-
98
-
99
-
100
-
101
-
102
-
103
-
104
-
105
-
106
-
107
-
108
-
109
-
110
-
111
-
112
-
113
-
114
-
115
-
116
-
117
-
118
-
119
-
120
-
121
-
122
-
123
-
124
-
125
-
126
-
127
-
128
-
129
-
130
-
131
-
132
-
133
-
134
-
135
-
136
-
137
-
138
-
139
 |
 |

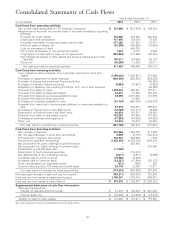
Consolidated Statements of Cash Flows
Year Ended December 31,
(In thousands) 2013 2012 2011
Cash flows from operating activities:
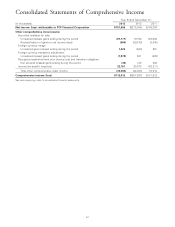
Net income (loss) attributable to TCF Financial Corporation $ 151,668 $ (212,884) $ 109,394
Adjustments to reconcile net income (loss) to net cash provided by operating
activities:
Provision for credit losses 118,368 247,443 200,843
Depreciation and amortization 117,950 109,192 73,183
Proceeds from sales of loans and leases held for sale 277,180 161,221 40,571
Gains on sales of assets, net (61,265) (140,665) (16,465)
Loss on termination of debt –550,735 –
Net income attributable to non-controlling interest 7,032 6,187 4,993
Originations of loans held for sale, net of repayments (353,982) (171,420) (32,987)
Net increase (decrease) in other assets and accrued expenses and other
liabilities 190,371 (67,985) 92,176
Other, net (36,288) 14,839 28,011
Net cash provided by operating activities 411,034 496,663 499,719
Cash flows from investing activities:
Loan originations and purchases, net of principal collected on loans and
leases (1,196,030) (1,353,981) 812,988
Purchases of equipment for lease financing (904,383) (938,228) (894,593)
Purchase of leasing and equipment finance portfolios –– (68,848)
Purchase of inventory finance portfolios (9,658) (37,527) (5,905)
Acquisition of Gateway One Lending & Finance, LLC, net of cash acquired –– (94,323)
Proceeds from sales of loans 1,378,235 560,421 167,911
Proceeds from sales of lease receivables 43,215 78,805 122,819
Proceeds from sales of securities available for sale 46,096 2,074,494 181,696
Proceeds from sales of other securities –14,550 –
Purchases of securities available for sale (47,734) (645,880) (1,039,379)
Proceeds from maturities of and principal collected on securities available for
sale 91,416 202,431 586,816
Purchases of Federal Home Loan Bank stock (18,789) (157,517) (6,663)
Redemption of Federal Home Loan Bank stock 40,976 197,571 29,093
Proceeds from sales of real estate owned 102,250 132,044 107,428
Purchases of premises and equipment (37,859) (44,082) (34,865)
Other, net 30,476 40,418 34,334
Net cash (used in) provided by investing activities (481,789) 123,519 (101,491)
Cash flows from financing activities:
Net increase in deposits 370,356 1,848,782 617,992
Net increase (decrease) in short-term borrowings 2,299 (3,797) (120,374)
Proceeds from long-term borrowings 744,348 1,283,466 1,898
Payments on long-term borrowings (1,120,402) (4,164,102) (376,087)
Net proceeds from public offerings of preferred stock –263,240 –
Net proceeds from public offering of common stock –– 219,666
Redemption of subordinated debt (71,020) ––
Redemption of trust preferred securities –(115,010) –
Net distributions to non-controlling interest (8,511) (3,411) (2,999)
Dividends paid on preferred stock (19,065) (5,606) –
Dividends paid on common stock (32,227) (31,904) (30,772)
Stock compensation tax (expense) benefit (473) (659) 280
Common shares sold to TCF employee benefit plans 20,179 19,462 17,971
Net cash (used in) provided by financing activities (114,516) (909,539) 327,575
Net (decrease) increase in cash and due from banks (185,271) (289,357) 725,803
Cash and due from banks at beginning of period 1,100,347 1,389,704 663,901
Cash and due from banks at end of period $ 915,076 $ 1,100,347 $ 1,389,704
Supplemental disclosures of cash flow information:
Cash paid (received) for:
Interest on deposits and borrowings $ 61,453 $ 108,524 $ 231,353
Income taxes, net $ (28,456) $ (13,376) $ (12,012)
Transfer of loans to other assets $ 112,463 $ 137,311 $ 175,361
See accompanying notes to consolidated financial statements.
59