TCF Bank 2013 Annual Report Download - page 107
Download and view the complete annual report
Please find page 107 of the 2013 TCF Bank annual report below. You can navigate through the pages in the report by either clicking on the pages listed below, or by using the keyword search tool below to find specific information within the annual report.-
 1
1 -
2
-
3
-
4
-
5
-
6
-
7
-
8
-
9
-
10
-
11
-
12
-
13
-
14
-
15
-
16
-
17
-
18
-
19
-
20
-
21
-
22
-
23
-
24
-
25
-
26
-
27
-
28
-
29
-
30
-
31
-
32
-
33
-
34
-
35
-
36
-
37
-
38
-
39
-
40
-
41
-
42
-
43
-
44
-
45
-
46
-
47
-
48
-
49
-
50
-
51
-
52
-
53
-
54
-
55
-
56
-
57
-
58
-
59
-
60
-
61
-
62
-
63
-
64
-
65
-
66
-
67
-
68
-
69
-
70
-
71
-
72
-
73
-
74
-
75
-
76
-
77
-
78
-
79
-
80
-
81
-
82
-
83
-
84
-
85
-
86
-
87
-
88
-
89
-
90
-
91
-
92
-
93
-
94
-
95
-
96
-
 97
97 -
 98
98 -
 99
99 -
 100
100 -
 101
101 -
 102
102 -
 103
103 -
 104
104 -
 105
105 -
 106
106 -
 107
107 -
 108
108 -
 109
109 -
 110
110 -
 111
111 -
 112
112 -
 113
113 -
 114
114 -
 115
115 -
 116
116 -
 117
117 -
118
-
119
-
120
-
121
-
122
-
123
-
124
-
125
-
126
-
127
-
128
-
129
-
130
-
131
-
132
-
133
-
134
-
135
-
136
-
137
-
138
-
139
 |
 |

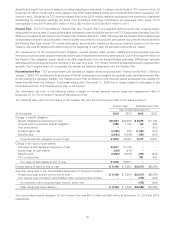
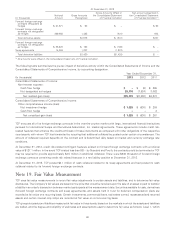
includes valuations that are based on prices obtained from independent pricing sources for the same instruments traded in active
markets; Level 2, which includes valuations that are based on prices obtained from independent pricing sources that are based
on observable transactions of similar instruments, but not quoted markets; and Level 3, for which valuations are generated from
Company model-based techniques that use significant unobservable inputs. Such unobservable inputs reflect estimates of
assumptions that market participants would use in pricing the asset or liability.
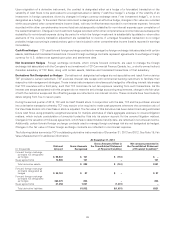
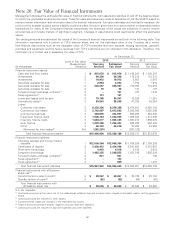
The following tables present the balances of assets and liabilities measured at fair value on a recurring and non-recurring basis.
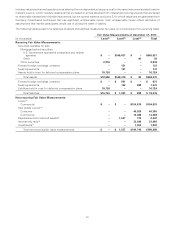
Fair Value Measurements at December 31, 2013
(In thousands) Level(1) Level(2) Level(3) Total
Recurring Fair Value Measurements:
Securities available for sale:
Mortgage-backed securities:
U.S. Government sponsored enterprises and federal
agencies $ – $548,037 $ – $548,037
Other – – 93 93
Other securities 2,934 – – 2,934
Forward foreign exchange contracts – 151 – 151
Swap agreements – 131 – 131
Assets held in trust for deferred compensation plans 16,724 – – 16,724
Total assets $19,658 $548,319 $ 93 $568,070
Forward foreign exchange contracts $ – $ 921 $ – $ 921
Swap agreements – 132 899 1,031
Liabilities held in trust for deferred compensation plans 16,724 – – 16,724
Total liabilities $16,724 $ 1,053 $ 899 $ 18,676
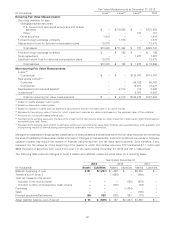
Non-recurring Fair Value Measurements:
Loans:(4)
Commercial $ – $ – $104,576 $104,576
Real estate owned:(5)
Consumer – – 40,355 40,355
Commercial – – 14,088 14,088
Repossessed and returned assets(5) – 1,537 730 2,267
Interest-only strip(6) – – 33,098 33,098
Investments(7) – – 1,902 1,902
Total non-recurring fair value measurements $ – $ 1,537 $194,749 $196,286
91