Radio Shack 2003 Annual Report Download - page 57
Download and view the complete annual report
Please find page 57 of the 2003 Radio Shack annual report below. You can navigate through the pages in the report by either clicking on the pages listed below, or by using the keyword search tool below to find specific information within the annual report.-
 1
1 -
2
-
3
-
4
-
5
-
6
-
7
-
8
-
9
-
10
-
11
-
12
-
13
-
14
-
15
-
16
-
17
-
18
-
19
-
20
-
21
-
22
-
23
-
24
-
25
-
26
-
27
-
28
-
29
-
30
-
31
-
32
-
33
-
34
-
35
-
36
-
37
-
38
-
39
-
40
-
41
-
42
-
43
-
44
-
45
-
46
-
 47
47 -
 48
48 -
 49
49 -
 50
50 -
 51
51 -
 52
52 -
 53
53 -
 54
54 -
 55
55 -
 56
56 -
 57
57 -
 58
58 -
 59
59 -
 60
60
 |
 |

RADIOSHACK 2003 Annual Report 55
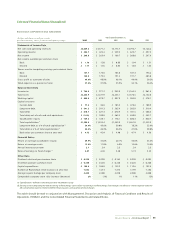
Selected Financial Data (Unaudited)
RADIOSHACK CORPORATION AND SUBSIDIARIES
(Dollars and shares in millions, except
Year Ended December 31,
per share amounts,ratios,locations and square footage) 2003
2002 2001 2000 1999
Statements of Income Data
Net sales and operating revenues $4,649.3 $ 4,577.2 $4,775.7 $4,794.7 $4,126.2
Operating income $ 483.7 $ 425.4 $ 359.3 $ 629.7 $ 497.3
Net income $ 298.5 $ 263.4 $ 166.7 $ 368.0 $ 297.9
Net income available per common share:
Basic $ 1.78 $ 1.50 $ 0.88 $ 1.94 $ 1.51
Diluted $ 1.77 $ 1.45 $ 0.85 $ 1.84 $ 1.43
Shares used in computing earnings per common share:
Basic 167.7 173.0 183.8 187.3 194.2
Diluted 168.9 179.3 191.2 197.7 205.0
Gross profit as a percent of sales 49.8% 48.9% 48.1% 49.4% 50.5%
SG&A expense as a percent of sales 37.4% 37.8% 35.9% 34.1% 36.2%
Balance Sheet Data
Inventories $ 766.5 $ 971.2 $ 949.8 $1,164.3 $ 861.4
Total assets $2,243.9 $ 2,227.9 $2,245.1 $2,576.5 $2,142.0
Working capital $ 808.5 $ 878.7 $ 887.9 $ 585.8 $ 478.1
Capital structure:
Current debt $ 77.4 $ 36.0 $ 105.5 $ 478.6 $ 188.9
Long-term debt $ 541.3 $ 591.3 $ 565.4 $ 302.9 $ 319.4
Total debt $ 618.7 $ 627.3 $ 670.9 $ 781.5 $ 508.3
Total debt, net of cash and cash equivalents $ (16.0) $ 180.8 $ 269.5 $ 650.8 $ 343.7
Stockholders’ equity $ 769.3 $ 728.1 $ 778.1 $ 880.3 $ 830.7
Total capitalization(1) $1,388.0 $ 1,355.4 $1,449.0 $1,661.8 $1,339.0
Long-term debt as a % of total capitalization(1) 39.0% 43.6% 39.0% 18.2% 23.9%
Total debt as a % of total capitalization(1) 44.6% 46.3% 46.3% 47.0% 38.0%
Book value per common share at year end $ 4.73 $ 4.24 $ 4.40 $ 4.74 $ 4.36
Financial Ratios
Return on average stockholders’ equity 39.9% 35.0% 20.1% 43.0% 35.5%
Return on average assets 13.4% 11.8% 6.9% 15.6% 14.4%
Annual inventory turnover 2.7 2.4 2.3 2.4 2.3
Ratio of earnings to fixed charges(2) 4.87 4.40 3.28 5.73 5.55
Other Data
Dividends declared per common share $ 0.250 $ 0.220 $ 0.165 $ 0.220 $ 0.205
Dividends paid per common share $ 0.250 $ 0.220 $ 0.220 $ 0.220 $ 0.200
Capital expenditures $ 189.6 $ 106.8 $ 139.2 $ 119.6 $ 102.4
Number of RadioShack retail locations at year end 7,042 7,213 7,373 7,199 7,186
Average square footage per company store 2,450 2,400 2,350 2,300 2,300
Comparable company store sales increase (decrease) 2% (1%) 1% 11% 12%
(1) Capitalization is defined as total debt plus total stockholders’ equity.
(2) Earnings used in computing the ratio of earnings to fixed charges consist of pre-tax earnings and fixed charges.Fixed charges are defined as interest expense related to
debt, amortization expense related to deferred financing costs, and a portion of rental charges.
This table should be read in conjunction with Management’s Discussion and Analysis of Financial Condition and Results of
Operations (“MD&A”) and the Consolidated Financial Statements and related Notes.