Radio Shack 2003 Annual Report Download - page 27
Download and view the complete annual report
Please find page 27 of the 2003 Radio Shack annual report below. You can navigate through the pages in the report by either clicking on the pages listed below, or by using the keyword search tool below to find specific information within the annual report.-
 1
1 -
2
-
3
-
4
-
5
-
6
-
7
-
8
-
9
-
10
-
11
-
12
-
13
-
14
-
15
-
16
-
 17
17 -
 18
18 -
 19
19 -
 20
20 -
 21
21 -
 22
22 -
 23
23 -
 24
24 -
 25
25 -
 26
26 -
 27
27 -
 28
28 -
 29
29 -
 30
30 -
 31
31 -
 32
32 -
 33
33 -
 34
34 -
 35
35 -
 36
36 -
 37
37 -
38
-
39
-
40
-
41
-
42
-
43
-
44
-
45
-
46
-
47
-
48
-
49
-
50
-
51
-
52
-
53
-
54
-
55
-
56
-
57
-
58
-
59
-
60
 |
 |

RADIOSHACK 2003 Annual Report 25
Future payments under the tax sharing agreement will vary
based on the level of O’Sullivan’s future earnings and are
also dependent on O’Sullivan’s overall financial condition
and ability to pay.There can be no assurances that future
payments will be received under the tax sharing agreement
each quarter, nor can we give any assurances as to the
amount of payment that may be received each quarter.
Provision for Income Taxes
Our provision for income taxes reflects an effective income
tax rate of 36.9% for 2003 and 38.0% for 2002.The decrease
in the effective tax rate for 2003, when compared to 2002,
was the result of a favorable tax settlement related to prior
year tax matters.We anticipate that the effective tax rate for
2004 will be approximately 38.0%.
2002 COMPARED WITH 2001
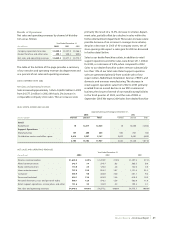
Net Sales and Operating Revenues
Sales decreased approximately 4.2% to $4,577.2 million in
2002 from $4,775.7 million in 2001.This decrease was pri-
marily the result of a 38.7% decline in sales to our
dealer/franchise outlets in 2002, mainly due to the decline
in DTH unit sales. In addition, we also had a 1% decrease in
comparable company store sales due primarily to the
decline of DTH unit sales and desktop computers, but offset
by sales increases in wireless handsets and related acces-
sories. Retail support operations, service plans and other
sales decreased 26.2% from 2001 to 2002 primarily as a
result of a $19.1 million decrease in 2002 domestic manu-
facturing sales due to large Verizon fixture sales in 2001
and a $15.2 million decrease in RSIS sales as a result of our
exit from the national commercial installation business at
the end of 2001. Sales in the wireless communication
department increased 9.4% in dollars and increased to
31.1% of our total sales in 2002 from 27.2% in 2001.This
sales increase was due to an increase in sales of wireless
handsets and accessories which resulted from our empha-
sis on national carrier offerings with desirable product
features and content, such as color screens, photo capabil-
ity and Internet access. Sales in the wired communication
department decreased 1.0% in dollars and increased
slightly as a percentage of our total sales to 8.3% in 2002
from 8.0% in 2001. Increased sales of cordless telephones
were more than offset by decreased sales of corded tele-
phones. Sales in the radio communication department
decreased 8.7% in dollars and decreased slightly as a per-
centage of our total sales to 2.6% in 2002 from 2.8% in
2001.The decrease in this department was primarily the
result of a decrease in Family Radio Service (“FRS”) and CB
radio sales, scanner sales and communication accessories,
partially offset by a sales increase in GPS devices. Sales in
the home entertainment department decreased 23.7% in
dollars and decreased as a percentage of our total sales to
18.7% in 2002 from 23.5% in 2001. Substantially all of the
dollar decrease was attributable to a decrease in sales of
satellite dishes and related installations.This decrease was
partially offset by increased sales of DVD players. Sales in
the computer department decreased 0.9% in dollars and
increased as a percentage of our total sales to 10.0% in
2002 from 9.6% in 2001.These sales dollars were maintained
primarily due to an increase in laptop computers, computer
accessories and digital camera sales, offset by a decline in
unit sales of desktop CPUs and monitors.Sales in the power
and technical department increased 0.8% in dollars and
also as a percentage of our total sales to 13.6% in 2002
from 13.0% in 2001.These increases were primarily due to
increased sales of general and special purpose batteries,
partially offset by decreased sales of bulk and packaged
wire and technical parts. Sales in the personal electronics,
toys and personal audio department increased 2.6% in
dollars, as well as increasing as a percentage of our total
sales to 12.6% in 2002 from 11.8% in 2001, due primarily to
increased sales of micro radio-controlled cars and related
accessories, in addition to unique giftables.
Gross Profit
Gross profit in 2002 was $2,238.3 million or 48.9% of net
sales and operating revenues, compared with $2,296.8 mil-
lion or 48.1% of net sales and operating revenues in 2001.
Gross profit decreased $58.5 million or 2.5% in 2002, prima-
rily as a result of a 4.2% decrease in net sales and operating
revenues.Despite this decrease in gross profit dollars, the
gross profit percentage increased from 48.1% to 48.9% in
2002, due primarily to an increase in the gross profit per-
centage in the home entertainment department and, to a
lesser extent, increases in both the power and technical
and computer departments’ gross profit percentages. Our
gross profit percentage increase was partially offset by
reductions in both the wireless and wired departments’
gross profit percentages, compounded by the increase in
the wireless communication department’s percent of total
retail sales.The reduction in gross profit dollars was par-
tially offset by a decrease in the total sales mix attributable
to the home entertainment department, which has a lower
gross profit percentage than our overall average gross
profit percentage, as well as an increase in gross profit dollars